Implementing Comprehensive Security Logging in GCP with Terraform

Andd were back! Going to be doing these Terraform GCP Security posts for a hot minute.
Today is about collecting logs, but its not just about well collecting logs; it’s about ensuring you’re capturing the right data, storing it securely, and making it readily available for analysis. This post will jump into implementing a comprehensive(comprehensive may be a stretch for an Enterprise) security logging system in Google Cloud Platform (GCP) using Terraform.
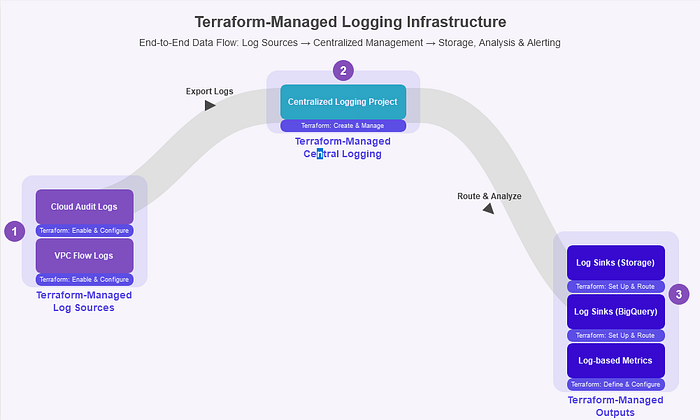
Our Logging Architecture
We’ll set up the following components:
1. Cloud Audit Logs for capturing all admin activities
2. VPC Flow Logs for network traffic analysis
3. A dedicated logging project for centralized log management
4. Log sinks to export logs to Cloud Storage and BigQuery
5. Log-based metrics for real-time alerting

Let’s dive into the Terraform code that makes the magic happen.

Step 1: Setting Up the Logging Project
First, we’ll create a dedicated project for our logs:
resource "google_project" "logging_project" {
 name = "centralized-logging"
 project_id = "centralized-logging-${random_id.project_id.hex}"
 org_id = var.organization_id
 billing_account = var.billing_account
}
resource "random_id" "project_id" {
 byte_length = 4
}
Why a dedicated project JUST for logging? See these docs:

Google Logging Docs , still unsure? Essentially, centralizing management and removing conflict of interest/management overhead.
Step 2: Enabling Cloud Audit Logs
Now, let’s ensure Cloud Audit Logs are enabled for all services:
resource "google_project_iam_audit_config" "audit_config" {
 project = google_project.logging_project.project_id
 service = "allServices"
 audit_log_config {
 log_type = "ADMIN_READ"
 }
 audit_log_config {
 log_type = "DATA_WRITE"
 }
 audit_log_config {
 log_type = "DATA_READ"
 }
}
Step 3: Setting Up VPC Flow Logs
For network traffic analysis, we’ll enable VPC Flow Logs:
resource "google_compute_subnetwork" "subnet_with_logging" {
 name = "logging-subnet"
 ip_cidr_range = "10.2.0.0/16"
 region = "us-central1"
 network = google_compute_network.vpc_network.id
 project = google_project.logging_project.project_id
log_config {
 aggregation_interval = "INTERVAL_5_SEC"
 flow_sampling = 0.5
 metadata = "INCLUDE_ALL_METADATA"
 }
}
resource "google_compute_network" "vpc_network" {
 name = "logging-network"
 auto_create_subnetworks = false
 project = google_project.logging_project.project_id
}
Step 4: Creating Log Sinks
We’ll create log sinks to export our logs to both Cloud Storage (for long-term retention) and BigQuery (for analysis) IF you are doing this in a real enterprise you may want to look to your SOAR or SIEM team and see where you can integrate into the Enterprise solution:
resource "google_storage_bucket" "log_bucket" {
  name     = "centralized-logs-${random_id.project_id.hex}"
  location = "US"
  project  = google_project.logging_project.project_id
}

resource "google_bigquery_dataset" "logs_dataset" {
  dataset_id  = "security_logs"
  description = "Dataset for security logs"
  location    = "US"
  project     = google_project.logging_project.project_id
}

resource "google_logging_project_sink" "storage_sink" {
  name        = "storage-sink"
  destination = "storage.googleapis.com/${google_storage_bucket.log_bucket.name}"
  filter      = "logName:(cloudaudit.googleapis.com OR compute.googleapis.com)"

  unique_writer_identity = true
  project                = google_project.logging_project.project_id
}

resource "google_logging_project_sink" "bigquery_sink" {
  name        = "bigquery-sink"
  destination = "bigquery.googleapis.com/projects/${google_project.logging_project.project_id}/datasets/${google_bigquery_dataset.logs_dataset.dataset_id}"
  filter      = "logName:(cloudaudit.googleapis.com OR compute.googleapis.com)"

  unique_writer_identity = true
  project                = google_project.logging_project.project_id
}
Step 5: Setting Up Log-Based Metrics
Finally, let’s set up some log-based metrics for real-time alerting. The below gives us a few different Suspicious events to setup based on incoming log metrics. This really is an example and heavy customization for your own organizations TTPs should be considered here.
Don’t know what TTP’s are? I’ll just leave this here for you: https://attack.mitre.org/resources/
Alright back to our Examples!
resource "google_logging_metric" "suspicious_activity_metric" {
 name = "suspicious-activity"
 filter = "resource.type=\"gce_instance\" AND jsonPayload.event_subtype=\"vm_login\" AND jsonPayload.event_type=\"audit_log\" AND jsonPayload.method_name=\"google.cloud.compute.v1.Instances.start\""
 metric_descriptor {
 metric_kind = "DELTA"
 value_type = "INT64"
 unit = "1"
 }
 project = google_project.logging_project.project_id
}
resource "google_monitoring_alert_policy" "suspicious_activity_alert" {
 display_name = "Suspicious Activity Alert"
 combiner = "OR"
 conditions {
 display_name = "Suspicious VM Start"
 condition_threshold {
 filter = "metric.type=\"logging.googleapis.com/user/${google_logging_metric.suspicious_activity_metric.id}\" resource.type=\"gce_instance\""
 duration = "0s"
 comparison = "COMPARISON_GT"
 threshold_value = 0
 }
 }
notification_channels = [google_monitoring_notification_channel.email.name]
 project = google_project.logging_project.project_id
}
resource "google_monitoring_notification_channel" "email" {
 display_name = "Email Notification Channel"
 type = "email"
 labels = {
 email_address = "security@example.com"
 }
 project = google_project.logging_project.project_id
}
Putting It All Together
This Terraform configuration sets up a comprehensive logging system that:
- Centralizes logs in a single project for, more abstraction and centralized management!
2. Captures audit logs and network VPC logs ( performance logs what are those?)
3. Exports said logs to both Cloud Storage and BigQuery ( you can setup exports using Pub/Sub models here to external programs, Splunk, Azure Sentinel, Grafana whatever you need!)
4. Sets up real-time alerting for suspicious activities
Building this out in Terraform let’s you manage this state externally, you want to add more log types? Custom Log filters? Different sinks? Well now its all in Terraform, you’re not just collecting logs and staring at a stream of alerts or filling a bucket — you’re building a Secure monitoring infrastructure.
Whats our Usability when all said and done in GCP?
- We can, conduct forensic investigations on historical data
- Perform real-time threat detection
- Meet compliance requirements for log retention ( with more work of course)
- Analyze traffic patterns for anomaly detection
Stay vigilant, and happy securing!


