Ronald OpioGenerating Vertical Column Densities from Numerical ModelsComparing the output of chemical transport models to satellite observations requires that the model ouputs are integrated vertically to…Aug 6, 2022Aug 6, 2022
Ronald OpioPlotting Wind from ERA5 ReanalysisThis article demonstrates how one can plot wind maps from ERA5 renalaysis using python. ERA5 is a 5th generation reanalysis dataset…Aug 6, 2022Aug 6, 2022
Ronald OpioUsing HARP toolkit for reading and regridding satellite dataThe European Space Agency (ESA) has developed a new data processing toolkit called HARP, for handling remotely sensed data from their new…Jun 23, 2022Jun 23, 2022
Ronald OpioVisualizing TROPOMI data using JavaScript and PythonThe new generation high resolution TROPOspheric Monitoring Instrument (TROPOMI) is the most capable remote sensing instrument for…Jun 19, 2022Jun 19, 2022
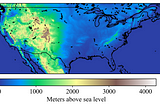
Ronald OpioThe Easiest Way to Plot TopographyThis can be done in two (2) simple steps as decribed below.May 22, 2022May 22, 2022