Age and voter turnout
They say elections are decided by those who show up to vote.
There are many inequalities that affect turnout and therefore shift voting power from some groups and to others. Age is one of the strongest of these factors, and it has been since we’ve been able to measure it well. There have been some changes over time, but the basic result, that the young vote less than the old and that turnout climbs with each additional year of life, is one of the most robust findings in political science.
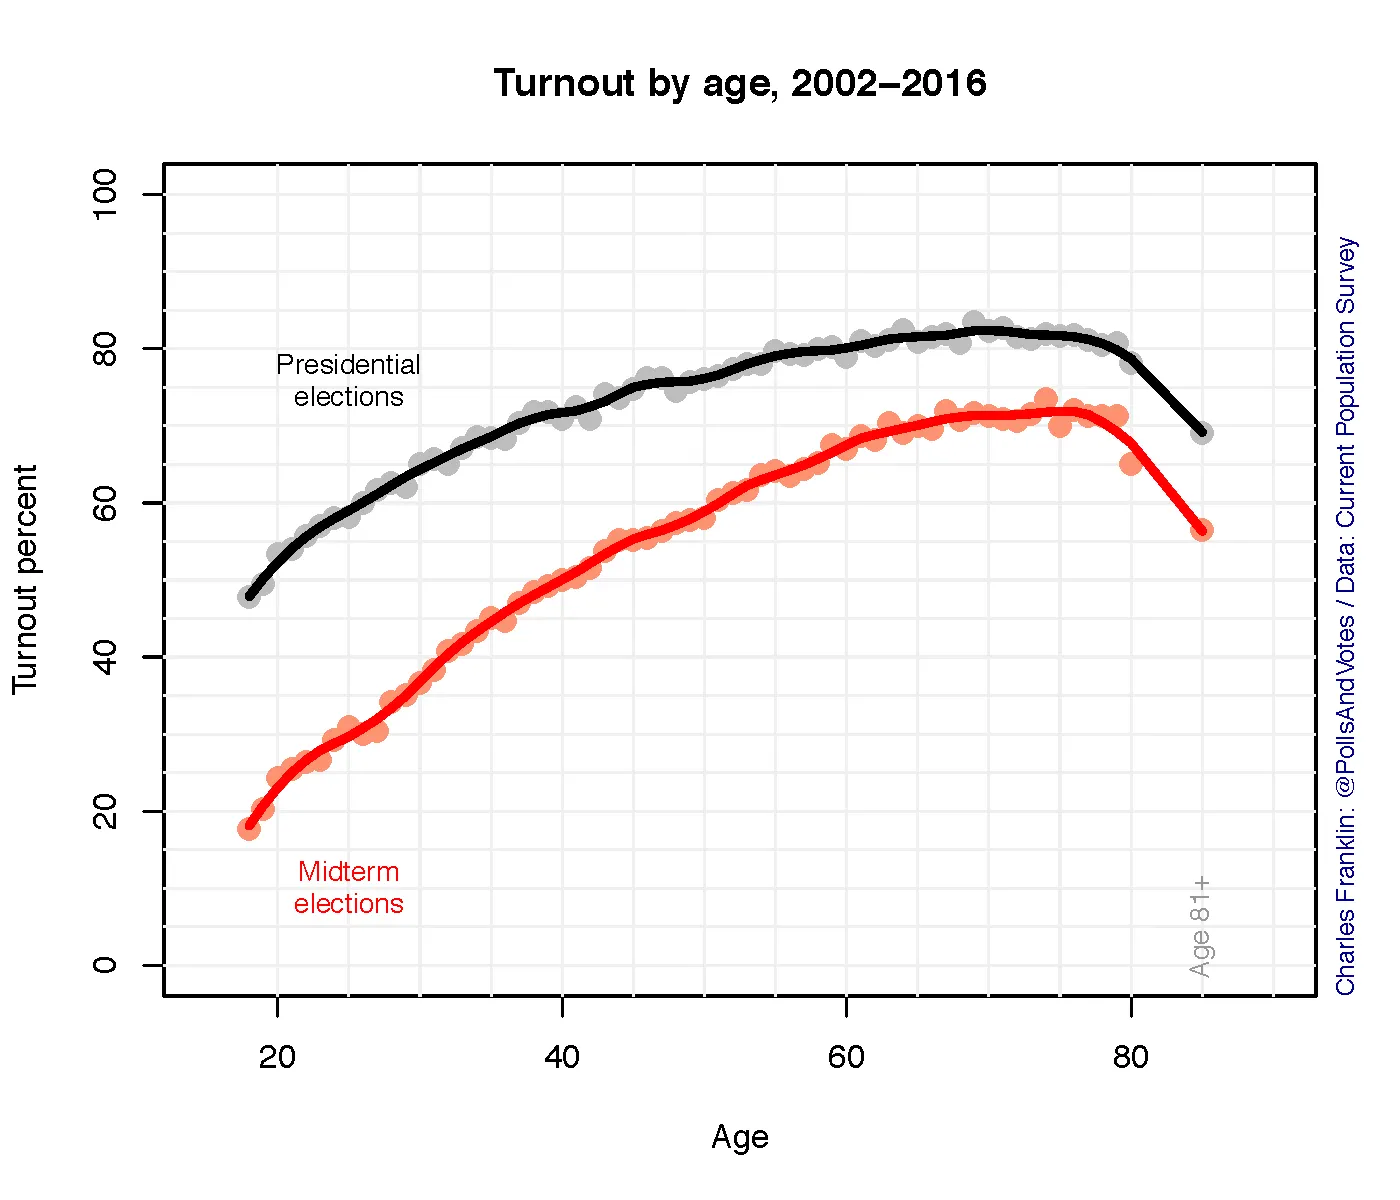
In a presidential year, the youngest voters, 18–29, turn out at a 47–65 percent rate, while those in their 60s exceed an 80 percent turnout rate. In midterms, those under 30 turn out at 17–35 percent while those in their 60s vote at a 70 percent rate. (These are self-reported rates among U.S. citizens. See note at bottom for more details on the data.)
That sharp rise with age, which is also very regular in its increase with each year of age, means that those under 30 are always underrepresented among the voting populationwhile those older than about 45 are over represented.
The gap between presidential and midterm elections is particularly notable as we approach the 2018 midterm. Relative to presidential years, the younger a person is the lower their likelihood of voting in a midterm compared to a presidential election. To the extent the young are underrepresented in presidential years, they are even more underrepresented in midterm electorates.
The tipping point of representation comes at about 36 years old, when share of population and share of voters becomes about equal. After 45, the share of voters exceeds share of population. (I use 2016 data only here to avoid changes in the age distribution.)

There has been some variation in turnout over time, especially among the younger voters.

Turnout among the youngest citizens bumped up substantially between 2000 and 2004, perhaps reflecting the closeness of the 2000 election result. Turnout rose again in 2008 before falling back a bit in 2012 and 2016. While there is some varation by year among those over 50 it is more modest compared to the year-to-year changes we see below age 30 or 35. Younger citizens appear to respond more to short-term, election specific presidential campaign forces than do their elders. It is worth noting as well that the increase in voting among those under 35 has sustained its overall increase compared to 1996 and 2000. That increase, obviously, has not erased the age gradient, though it has flattened it somewhat.
Midterm turnout however has not seen any increase among the young.

Not only is turnout quite low among those under 30, the increase we see in presidential elections after 2000 are much smaller in midterms. If the last 5 midterms are a guide, we’d expect fewer than 1 in 3 people under 30 to cast a ballot this November.
There are many reasons why the young are less likely to vote. These include level of political interest, overcoming the initial barrier of registration to vote, a busy life of many changes, geographic mobility and simply not yet having developed the habit of voting. Some of these factors can be influenced by campaigns and efforts at mobilization. The increase in turnout after 2000 in presidential elections shows that some change can occur. The lack of substantial change in midterm turnout raises doubts as to how much mobilization can be effective in 2018.
UPDATE:
After posting this a number of comments asked about change over time, say the last 50 years. I mentioned in the post that this pattern of low turnout among the young and high among the old has been with us since we’ve been able to measure it. Here, from 1972, is the first year I have data from the CPS which is comparable. Here is 1972 with 2004–16 presidential for comparison. Turnout among the young is close to the same (45–65 for 18–30 year olds) but the peak among older voters is reached earlier with a long plateau from about 50 through 65, after which decline. The peak is later after 2004 and declines at an older age, perhaps a comment on healthy life expectancy then and now. (And for another day, the 1972 population still had women who had not grown up with the right to vote. Women’s turnout trailed men’s for quite a lot while among this early generation.)


Data note.
The analysis here is based on data from the Current Population Survey (CPS), conducted by the Census each month and the basis of, among other things, unemployment estimates. In November of election years, the CPS asks if respondents were registered to vote and if they in fact voted. (It does NOT ask how they voted.) This is a very large survey with an exceptionally high response rate (over 90%) and is widely considered the best self-reported vote measure we have. That said it is not infallible and there is a tendency to over-report turnout. Voter lists offer a new approach to this but national voter lists are not publicly available for this analysis, though some scholars have purchased access with good results. That said, the CPS gives a consistent measure going back to 1972 and is widely used in political science.