It’s not science, but that’s ok
I collaborated with Hans Hack on a visualization depicting sea-level rise. And this is what came out of it.
At a meetup of Maptime Berlin, I learned about Hans Hack’s project on metropolitan Alpes. Hans had tinkered with available geodata and JavaScript libraries to transform cities such as Hamburg, Brussels, London and Berlin into three-dimensional hilly islands. The visualizations are visually compelling, interactive and reminded me of the bird-eye views within the 1990s video game Monkey Island.
At the time, I was preparing a longer research trip to San Francisco, where I would interview scientists and programmers of sea level rise mappings. Grounded in scientific findings of climatology and hydrology, these cartographies show the impact of climate change-triggered ice melting in the Antarctic, Greenland and elsewhere. In the long term, such meltdown could lead to a veritable deluge, with seas rising up to several meters, flooding vast territories including densely populated areas. The interactive maps let users browse different scenarios of such scenarios, showing flooding as blue demarcated areas on the map. I am interested in such interactive data visualizations in context of my research, dealing with the making, communication and interpretation of predictive knowledge driven by computer simulation. During the last year, I have followed, observed and collaborated with scientists, communicators and designers, investigating how outputs of such computer simulations become common knowledge; for example in form of data visualizations, maps and other visual media formats. Considering the vulnerability of Californian cities to rising seas, several local and national organizations had worked on digital maps showing scenarios of floodings in California and the US; examples are NOAAs sea level rise viewer and Climate Centrals Risk Zone Map. To my knowledge, nothing comparable exists for the coasts of Germany and Europe.

Inspired by these projects, I asked Hans how difficult it would be to construct such a map showing probable futures with sea-level rise for selected places on Europe’s coasts. As open-ended project, we started experimenting with available data — satellite images, geolocation, elevation data, coding libraries for animation. The cooking recipe for the final animation can be described as follows:
Search for a free aerial image depicting your place of choice
As a dummy, we worked with high resolution imagery made available from Geoportal Berlin, depicting the German capital (and our home town). We are aware that Berlin is not threatened by sea-level rise.

Get elevation data
In order to add a third dimension to the city, you need a geo-data set, which does not only include horizontal coordinates (x- and y-dimension), but also the height of each geographic location (z-dimension) so-called elevation data, in our case taken from the OpenTopography Facility. While two-dimensional maps and satellite imagery have been available for a while now, the provision of elevation data is a rather new development, enabling astonishing landscapes in three dimensions. Considering that Berlin is flat like a disc, Hans exaggerated all elevations manifold. Berlin became properly alpine and striking in 3D.

The water and the flood
Our visualization builds on an existing project by French designer Nicolas Durou. Durou had constructed a beautiful animation with water washing round an island. The depicted territory can then be drowned into water by operating a visual slider. By sliding from left to the right, you can travel into more and more apocalyptic futures with sea-level rise. Durous’ simulation is made of existing code using three.js, a JavaScript Library used for 3D-animation.

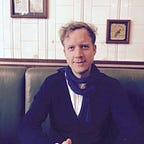
Now that we had all the ingredients together, Hans mashed up the imagery, the elevation data, the waves and the flooding scenarios. As a result of Hans’ data cooking skills, this resulted in a visually striking animation showing the impact of sea level rise on the island of Berlin. The result looks realistic, without representing anything real. It mashes up data from different times and spaces and draws it together into a new time-space of drowned datapoints.
Discover the interactive visualization here
On values of collaboration
Finally, we didn’t follow-up on the idea to actually build a visual model of flooding scenarios for Europe’s coast. While it would only take a short time to produce a compelling map, it would take ages, considerable funding and a big team of climatologists and hydrologists to make it not only persuasive, but scientifically and ethically sound. And we sticked to depiction of Berlin, because we like our city. Neverheless, I would argue that there is high value in such artist-scientific collaborations. Berlin Drowned in Simulation reminded me of the persuasive power inherent to cartography, the fluidity of imagery that marks our digital media culture, and the challenge to link abstract, scientific information with our daily life experiences (here in Berlin). Last but not least, it convinced me of the value of experimental collaborations within the context of the climate change debate.
What struck me in my interviews and informal discussions with climate scientists was the subliminal fear to say, write or draw something on climate change, which is not 100% scientifically sound or true”. Scientists often seem to feel uncomfortable when they’re talking to lay people and I repeatedly heard the sentence: “I can’t talk about x, because that’s not my expertise.” Such perceptions are fueled by the fear that their statements to outsiders could be instrumentalized by skeptics arguing against the reality of global warming. However, as the current US president is proving on a regular basis, post-truth politicians don’t care about scientific facts, processes and ethics. They will always find presumed lacks of proof in research, if this suits their agenda. This fear takes away much of the drive in climate change communication. And it curbs all attempts to cope with the challenges ahead. Instead of hiding in the ivory tower of science, I would recommend to push forward other strategies: experimental sites of collaborations, open data initiatives and an acceptance of frictions in science-public relationships.
It’s something that I took from my interviews with researchers in California. Compared to their colleagues in Germany, US climate researchers and institutions are much more proactive in opening up scientific knowledge to the public. Climate Central is the best example for this. The work of this science-public interface is so powerful, because they are operating from a stance outside the traditional institutional framework of science. All their projects are informed by state-of-the-art climate science, but their daily business is to engage with the public by triggering debates. Their social media channels are the most proliferic and vivid I know, and their visuals are aesthetically attractive, informative and up-to-date to events of interest to society and specific communities. As a matter of fact, such science-public interfaces must not necessarily be established as enduring institutions such as Climate Central. They can be short-time collaborations, gathering dedicated people in situated contexts. Inspiring examples are the science hacks convened by Climate KIC and the interpretation of climate knowledge by musicians of the Orchester des Wandels.
On frictions and boundary work
What can be the role of climate scientists in such arrangements? Some researchers are doing terrific work in explaining climate change to broader audiences. Stefan Rahmstorf was just rewarded a Climate Communications Price for his long-standing engagement to foster a better understanding of climate science in society. However, not everyone in the science community may be comfortable or interested in doing such mediation work on a daily basis. Therefore, an alternative strategy could be to just “let the data talk”. In recent years, there have been numerous open science initiatives making climate data accessible in the web. For example, the Potsdam Institute for Climate Impact Research has been working on ISIMIP, a platform gathering, harmonizing and presenting simulation outputs on impacts of climate change across affected sectors and spatial scales. As I would argue, such digital repositories do not only make scientific knowledge more accessible, but they also fulfill important functions of boundary work for researchers. They draw a line between the insights from scientific processes and the prospective use of this information outside science, releasing the researchers from the responsibility of interpretation: “Check out our results, and do whatever you like with it.” Naturally, this practice presupposes that researchers accept the fact that they will never be in control of the interpretation of knowledge by non-scientists. In my opinion, it would be beneficial to the cause, if natural scientists were a bit more receptive to such ways of letting go. Human perception just doesn’t work like a machine and the information-deficit model of communication is dead. Therefore, the translation of knowledge across boundaries of social worlds always comes with frictions. We should abolish thinking of these frictions as “complexity reductions”. Rather, every person has its own way of reconciling scientific insights with his or her body of knowledge, ethical framework and life priorities.
In the meantime, have fun in drowning Berlin in simulation.