WGYRProject (Refine Phase II)This week we kept improving our works and explored more interesting design spaces.May 12, 2020May 12, 2020
WGYRProject(Refine Phase)This week we explored more interesting design space and re-thinked obout our existing work and modified some of them.May 7, 2020May 7, 2020
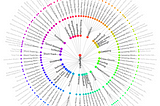
WGYRProject(2)This week we added some new visualization for project, now we will show the results.Apr 28, 2020Apr 28, 2020
WGYRProject (1)Recently, our team are working on the project and got some preliminary result. In the following blogs we’ll update our explorations of the…Apr 22, 2020Apr 22, 2020
WGYRData visualization with AltairPreviously we used Vega to design some visualizations, but it’s not convenient for a coder to program because we need the online editor…Apr 15, 20201Apr 15, 20201
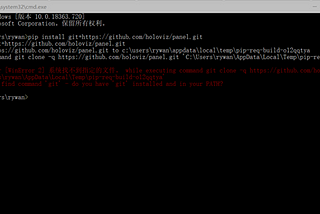
WGYRUsing Vega with Python and R: Problems met, solution and a demoVega can not only be used through IDE of its own, but also through other IDE’s like Rstudio or Jupyter Notebook of python. Here we will…Apr 6, 2020Apr 6, 2020
WGYRChoropleth of COVID-19 cases on 28/03/2020 per state in the USA choropleth map is a type of thematic map in which areas are shaded or patterned in proportion to a statistical variable that represents…Mar 30, 2020Mar 30, 2020
WGYRSketches of initial ideasDuring this week, we, Team WGYR, have created some initial sketches for the following visualisation. We did brainstorming separately and…Mar 19, 2020Mar 19, 2020
WGYRProject data descriptionThe theme of our project is about the Olympic and modern civilization, which is to explore the relationship between Olympic achievement…Mar 13, 2020Mar 13, 2020