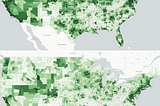
JP HwanginPlotlyBuilding a Big Data Geographical Dashboard with Open-Source ToolsMapping the U.S. power grid with Dash, Dask, and Datashader16 min read·Sep 3, 2021--2--2
JP HwanginTowards Data ScienceThe right data visualisation tool for the jobThoughts on a few leading data visualisation tools for all skill levels·5 min read·Feb 16, 2021--1--1
JP HwanginTowards Data ScienceColourscales are everything in data visualisation – are you using them correctly?How choosing the right colour and scales can make or break your message·8 min read·Nov 18, 2020--1--1
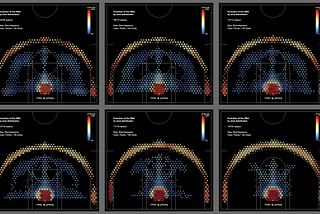
JP HwanginTowards Data ScienceVisualising evolution of the NBA offence through dataSee the dramatic changes to the NBA offences over the last 15 years to understand its history and imagine the future.·7 min read·Nov 18, 2020--1--1
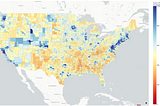
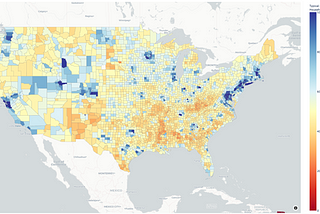
JP HwanginTowards Data ScienceMad Maps – visualizing geographical data for maximum impactHow to effectively communicate data on maps for clear, insightful insights with Python (code and data included)·10 min read·Nov 2, 2020----
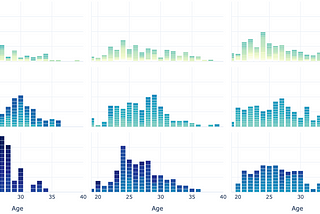
JP HwanginTowards Data ScienceWhat does data tell us about ageing in the modern NBA?A data-driven look at how ageing affects the modern NBA. How old are the league’s best players? Are modern players getting younger? Who’s…·7 min read·Oct 29, 2020----
JP HwanginTowards Data ScienceThe nocode revolution is coming — are you ready for it?Predicting a paradigm shift in the (programming) world, and how to not to get left behind in its wake.·7 min read·Oct 27, 2020--5--5
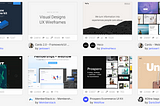
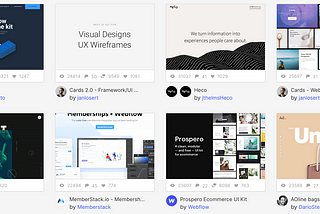
JP HwanginTowards Data ScienceBuild an awesome data science (or any) portfolio in no time with these toolsSave time & build a great looking online presence. What use do most data scientists have for raw HTML & CSS anyway?·11 min read·Oct 21, 2020--3--3
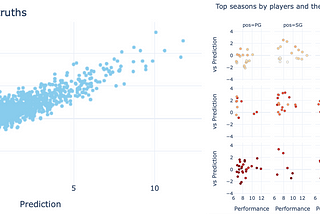
JP HwanginTowards Data ScienceLearn linear regression using scikit-learn and NBA data: Data science with sportsPractical linear regression with real-life data of NBA players with Python, visualise the outcomes & learnings (including data & code).·10 min read·Sep 18, 2020----
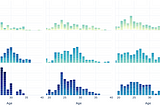
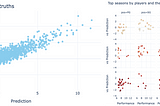
JP HwanginTowards Data ScienceExplore any data with a custom, interactive web app: Data science with sportsLearn how to build an interactive, reusable web app for exploratory data analysis with leading data visualisation tools Plotly and…·10 min read·Sep 6, 2020--2--2