Alan JonesThe Illusion of Openness: How AI Companies Are Gaming the SystemArtificial intelligence companies like to tout their products as “open source” or “open access.”6d ago6d ago
Alan JonesinAI AdvancesAnthropic Claude 3.5: A More Powerful but Cheaper LLMWe look at Anthropic’s new Claude 3.5 Sonnet LLM, explore the API and create a simple Streamlit chatbotJul 9Jul 9
Alan JonesinAI AdvancesHow to Build a ReAct AI Agent with Claude 3.5 and PythonWe present a Reason+Act agent that iteratively reasons and gathers information from external tools before providing an answer.Jun 291Jun 291
Alan JonesinTowards Data ScienceA Data Dashboard in Pure Python with TaipyTaipy is an innovative framework designed to simplify the creation of interactive and visually engaging data science applicationsJun 256Jun 256
Alan JonesinData Visualization, Data Science and PythonBeware of Algorithmically Generated Scales in Heat MapsAutomatically adjusted scales can be misleading. We examine issues and how we can resolve them.Jun 14Jun 14
Alan JonesinTowards Data ScienceFrom Data to Visualization with the OpenAI Assistants API and GPT-4oWe explore the Code Completion tool from OpenAI’s Assistants API to create visualizations directly from dataJun 122Jun 122
Alan JonesinTowards Data ScienceStreamlit Supports 5 Important Data Visualization Libraries — Which to Choose?We code examples using Altair, Bokeh, Plotly, Pandas Plot and Matplotlib, to illustrate the pros and cons of each oneMay 164May 164
Alan JonesinData Visualization, Data Science and PythonDevelop Streamlit Apps Online with Github CodespacesDevelop Streamlit apps online easily with Streamlit Community Cloud, Codespace and GitHub templatesApr 24Apr 24
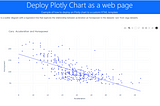
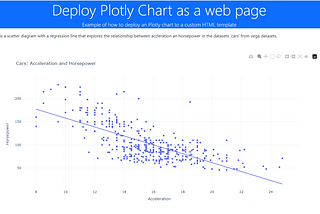
Alan JonesinData Visualization, Data Science and PythonHow to Deploy Plotly or Altair Graphics to a Simple Static Web PagePlotly has a native method to create basic web pages but with a little more effort, web templates get you a much better resultApr 21Apr 21