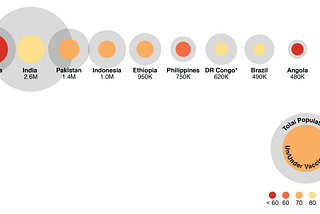
Alec BurchinHi.StamenVisualizing Global Immunization Rates with The World Health Org, 2019.We at Stamen have had the pleasure of working with the World Health Organization’s Department of Immunization, Vaccines, and Biologicals…Aug 19, 20192Aug 19, 20192
Alec BurchinHi.StamenMaking a 32ft wide mural for SPURWe keep finding ourselves here. Last time I published an article I spoke about how I went about creating a 3D cut map for Matson’s office…Feb 22, 2018Feb 22, 2018
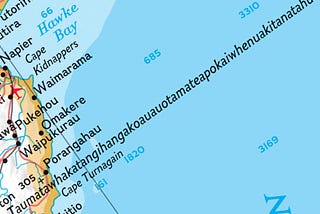
Alec BurchinHi.StamenCreating a giant 3D bathymetric map, out of 2D data, for MatsonSometimes at Stamen we get the chance to create physical works of data visualization for our clients in the tactile world. Matson recently…Sep 5, 20171Sep 5, 20171
Alec BurchinHi.StamenVisualizing infant vaccination rates for the World Health OrganizationEric Rodenbeck interviews Kai Chang and Alec Burch about their latest work with the World Health OrganizationJul 27, 2017Jul 27, 2017
Alec BurchinHi.StamenAll the Stamen data visualization history you can handle, now on Medium!Stamen has been working on data visualization projects for 15 years(!) — with nine years of blog posts on our work…scattered across a…Aug 15, 20161Aug 15, 20161
Alec BurchinHi.StamenSightlines Project: Visualizing Living Well in 21st-Century AmericaWe’ve been working with the Stanford Center on Longevity at Stanford University to bring to life their Sightlines Project. Stamen’s role…Feb 20, 2016Feb 20, 2016