PinnedAmy CesalinNightingaleWriting Alt Text for Data VisualizationHow do you write text that conveys the whole meaning of a visualization? You probably can’t. But that doesn’t mean that you shouldn’t tryJul 23, 20203Jul 23, 20203
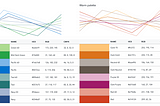
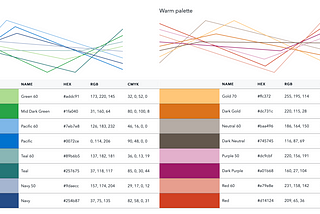
PinnedAmy CesalinNightingaleHow to Create Brand Colors for Data Visualization Style GuidelinesYour brand colors don’t work for data visualizationJul 13, 20205Jul 13, 20205
Amy CesalinNightingaleThe New Chore Wheel is a Waffle Chart5 steps for solving our division of chores, visualizedJan 14, 20211Jan 14, 20211
Amy CesalinNightingaleData Smellification — Smelling Data Saved My LifeWe usually associate our sense of vision to how we interpret data, but we can consume data with other senses, tooNov 30, 20201Nov 30, 20201
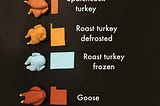
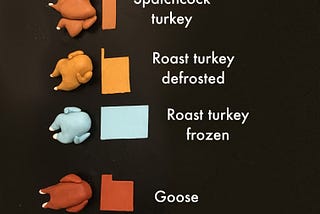
Amy CesalinNightingaleThanksgiving Turkey Cook TimesOn Thanksgiving last year, we spatchcocked the turkey, and it cooked way too quickly. None of the delicious sides were done cooking by the…Nov 19, 20202Nov 19, 20202
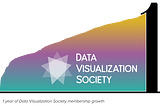
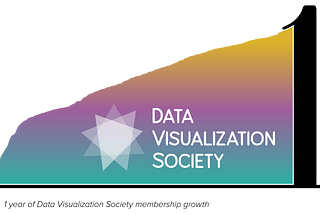
Amy CesalinNightingaleThe Data Visualization Society’s First Trip Around the SunDVS was started one year ago today. Let’s take a data-viz look at who is part of it and all we’ve accomplished so far.Feb 20, 20202Feb 20, 20202
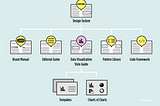
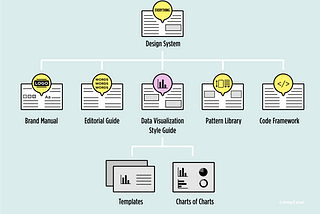
Amy CesalinNightingaleWhat Are Data Visualization Style Guidelines?Data visualization style guides are standards for formatting and designing representations of information.Jul 10, 20195Jul 10, 20195
Amy CesalinNightingaleWedding Data Viz: How We Designed for FeelingsWritten by Amy Cesal and Zander FurnasMay 28, 20194May 28, 20194
Amy CesalinNightingaleData Visualization Society Logo: Behind the scenesI’m Amy Cesal, one of the founding members of the Data Visualization Society and I’m a data viz and graphic designer. Every organization…Mar 6, 20196Mar 6, 20196