Analytics DecodedThe Origins of Modern Statistics and Design of ExperimentsDr. Ronald Fischer and the Tea ExperimentApr 8, 2020Apr 8, 2020
Analytics DecodedVisualizing the Pace of Global Coronavirus SpreadThe ongoing pandemic of coronavirus (COVID-19) needs no introduction. One of the things which is alarming is the rapid spread of this…Mar 27, 2020Mar 27, 2020
Analytics Decoded5 Tips for Effective Data VisualizationWhat not to do when designing dashboardsFeb 20, 2020Feb 20, 2020
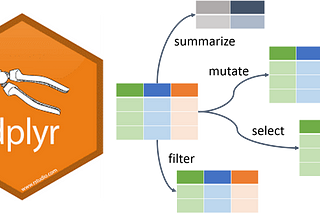
Analytics DecodedGetting Started with Data Manipulation in R with dplyrThe dplyr package is a life saver for data manipulation. Check out this post for a tutorial on dplyr functions and their usageJan 7, 20201Jan 7, 20201
Analytics DecodedCreating timeline charts in R — My fitness activityTimeline charts are powerful visual tools that display succession of events in chronological order. Several layers of detail can be added…Jul 11, 2019Jul 11, 2019
Analytics DecodedImportance of Sampling in the Era of Big DataAdvances in the digital age have helped us overcome some of the challenges that were traditionally faced with statistical sampling in the…Jun 3, 2019Jun 3, 2019