Databases
Unveiling PostgreSQL Instability: The Materialized View & WAL Segment Connection
A story about recurring stability issues within our production PostgreSQL cluster
In the fast-paced world of modern data management, ensuring the stability and reliability of your database cluster is paramount.
Recently, our team encountered a perplexing challenge that led us on a journey to uncover the root cause of recurring stability issues within our production PostgreSQL cluster.
Through diligent investigation and analysis, we unearthed a surprising culprit: materialized views and their impact on Write-Ahead Logging (WAL) segments.
In this blog post, I share my experiences, insights, and solutions, hoping to shed light on similar challenges faced by fellow database administrators.
Prerequisite
This article assumes that you have knowledge about the following concepts.
High level overview of our production cluster

Our production system runs on an AWS cloud. A cluster consists of 3 nodes (or instances). Each instance has 3 AWS EBS volume attached.
- System volume (having OS).
- Data volume with enabled compression (holding compressed data only).
- WAL volume (holding uncompressed WAL segments only).
High level overview of Write Ahead Log (WAL)
All the changes made to the database are logged first in a specific directory pg_wal (used to bepg_xlog) in Postgres before applying those changes to the actual DB as illustrated in the picture below.

How did the problem emerge?
We use Slack for internal communication. A guy from a sales team wrote about a problem in our support channel. He mentioned that he can successfully import products, but he is unable to view imported products on the products listing page.
Upon quick investigation reveals that the replica node was out-of-sync with the leader node. Hence, end user can still see successful imports but unable to see those products on the listing page.
Background:
We use separate connections for writing data to a leader node & reading data
from replica nodes.
But that was not the end.
We saw recurring instability in our production system. For instance:
- (Often) Replica node getting out-of-sync with the leader node.
- Sometimes the leader node has high disk usage (> 85%).
Hence, our team started working on this issue with high priority.
Observations & investigation insights
I started my investigation by plotting a graph regarding this recurring instability (since when it has been started).

My goal was to find some correlation during this timeframe. So I tried to plot different graphs. For instance, leader nodes over time (since we also perform manual switchover once during this timeframe).

How disk usage increases over time for our cluster. Here its getting interesting.
📝 Node 1 and Node 2 represents green & blue color respectively.
I found that a replica node reaches close to 100% disk utilization, and it correlates with that of the leader node.
But the question was … would this pattern persist for other (unstable) replica nodes as well? And the answer was yes.

Then I checked disk usage with respect to devices (or AWS EBS volume) attached to the instance in our cloud.

And it turned out that WAL segments consumed all the disk space. This explains why replica nodes are getting out-of-sync with the leader node. Because no space left for new WAL segments from the leader node.
However, it is still not clear who is creating a massive amount of WAL segments.
That’s why I analyzed Postgres server logs to find some hints from there. I plotted a graph to determine the slowest query with respect to SQL operation (such as SELECT, INSERT etc.).

In the above graph, the operation CALLrefers to refreshing materialized view in postgresqland is the slowest operation among other operations.
It is important to note that we have introduced this materialize view recently. Hence, I did little research to validate my findings (Could these views generates a lot of WAL segments?).
And it turns out to be true. As per this stackoverflow post:
Creating a materialized view can produce a lot of transaction log (WAL) if the materialized view is large, and this may cause replication to lag for a while if the network connection isn’t fast.
And our view has total size of 50GB.
What we did to stabilize our cluster?
We took the following steps to stabilize our cluster, but we are still trying to find a more reliable solution.
- We use more powerful instances (in terms of resources such as memory / CPU) with in-house disk space for data only (as opposed to cloud — AWS EBS volume). This improves network latency to some extent.
- Revisited SQL query for our materialized view with respect to our business requirement and narrow down results from 34 million rows to 4.3 million rows.
So far, our cluster is stable, but we are planning to drop materialized view in the long-term and go for something else.
Does this mean one should avoid using materialize view?
No, that’s not the whole point of this article.
My only point here is to raise awareness that it can impact the health of your cluster. So, keep an eye on your cluster after introducing it.
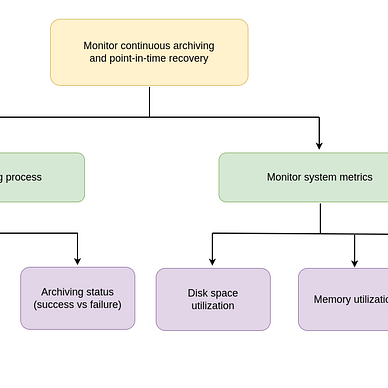
Metric worth monitoring
It gives the timestamp of the last WAL segment being played on a replica node.
select timezone('utc', pg_last_xact_replay_timestamp()),
  pg_is_in_recovery() as is_replica;
If this timestamp exceeds a certain threshold (say 15 min), then the replica node is not replaying WAL segments. Manual intervention is required.
My takeaway from this incident
I learned that
it will help any indivisual in investigation and resolving issues if he/she is aware of the changes made to the system over time (some kind of a timeline).
As an analogy, you can think of it like your house doctor. If he/she knows your history, he/she can do better treatment for your illness as opposed to the one who is unaware of the history.
So, having a change log (or timeline) will help you in fast & better solution. If you are aware of any such tool, please let me know in comment’s section. I would be very thankful to you.
Thanks for reading.
I hope that sharing my experience will serve as a guiding light for fellow database administrators navigating similar challenges in their own systems
If you enjoy this post, you might also like my following series.


Get my posts directly in your inbox