Anna OlsonMy charts for the finalI feel like I need some help deciding what kind of charts would be best for my final so hopefully Wednesday when we peer review that can…2 min read·Nov 25, 2018----
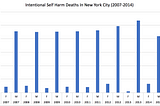
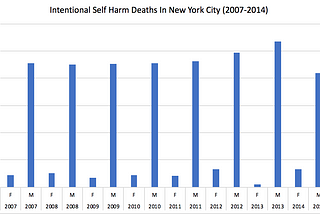
Anna OlsonA Look at 2014 Suicides in NYCThis is a graph that shows the progression of suicide deaths from 2007 to 2014.2 min read·Oct 21, 2018----
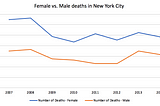
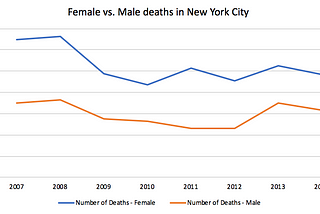
Anna OlsonFemale vs. Male Deaths in NYCThis is my 3rd chart for my midterm. I compared all the recorded deaths between men and women in NYC. I wanted to compare the average age…1 min read·Oct 14, 2018----
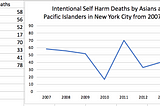
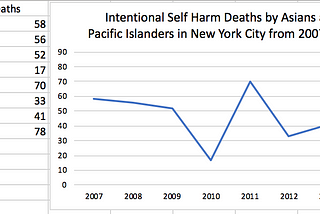
Anna OlsonVisualizing Data HomeworkThis is my second midterm chart. This data is about suicides in NYC by Asian and Pacific Islanders. I wanted to do something with more…1 min read·Oct 4, 2018----
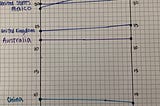
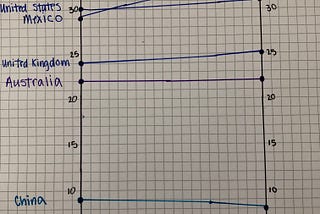
Anna OlsonHomework 09/23CO2 emissions from transportation in United States, Mexico, United Kingdom, Australia, and China.1 min read·Sep 23, 2018----
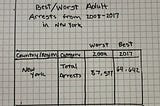
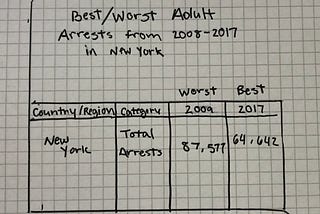
Anna OlsonThis is my drawn chart for best and worst number of arrests in New York from 2008–2017.1 min read·Sep 9, 2018----
Anna OlsonOne TakeawayJournalism Handbook: I thought the very beginning of this article about questions you need answered was the most interesting part. It is so…1 min read·Sep 9, 2018----