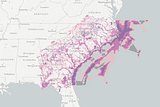
A new tool for visualizing bat detections across North AmericaExplore over 6 million detections from 34 species to better understand and conserve bats in North America.Dec 4, 201967Dec 4, 201967
How to leverage Geopandas for faster snapping of points to linesA step-by-step walkthrough of how to use Geopandas to snap (spatially align) points to a linear network.Oct 6, 20191453Oct 6, 20191453
Introducing Geofeather, a Python library for faster geospatial I/O with GeopandasBased on the awesome feather file format, Geofeather enables faster file-based I/O for intermediate geospatial files.Oct 4, 2019224Oct 4, 2019224
Migrating from Create React App and Leaflet to GatsbyJS and Mapbox GLReworking an application for faster, easier builds and better performance.May 3, 201972May 3, 201972
Adding value when goals are unclearI’ve been struggling with a situation at work where I am being asked to help define how much effort is required to meet a major business…Mar 20, 201843Mar 20, 201843
Delight is the glue between data and engagement“Fareless” read the sign on the side of the bus as it passed by me this morning. Just think about how much more delightful it would be with…Nov 6, 201737Nov 6, 201737
1 Hour cross-team brainstormingWe recently had the opportunity to get our software development team together with our conservation planning and assessment team. The…Oct 29, 2017Oct 29, 2017
Storytelling with Data: Conservation Priorities in Your PocketLike many areas, the Southeast is a region where collaboration, consensus, and engagement are critical to success. Like our first story…Oct 10, 20173Oct 10, 20173
Storytelling with Data: Site History For Rare PlantsMy first story is about visualizing the history of rare plant populations in southern California. Our heroes are land managers that manage…Oct 10, 2017Oct 10, 2017
Storytelling with Data: IntroductionThis is a slightly modified version of a talk I gave at the 2017 Symposium by the Sea in Florence, Oregon.Oct 10, 2017Oct 10, 2017
That incredibly freeing moment when you realize you are not the problemHave you ever hacked away at a problem for hours, days, or longer, only to realize that the problem wasn’t actually coming from you?Sep 25, 20171Sep 25, 20171
Sharing — and receiving — perspective as a giftSometimes, seeing a particular situation from another angle is transformative: it can completely change you from that moment forward. Or it…Sep 24, 2017Sep 24, 2017
Effective leadersEffective leaders create, communicate, and reinforce tangible goals toward broader impactsAug 27, 20171Aug 27, 20171