Birth of ARIA
Artificial Intelligence for Malaria Diagnosis.
ARIA introduces a new way of diagnosing malaria by classifying red blood cell images using efficient deep learning techniques.

So short story , sad story actually 😢, before the birth of ARIA , I had contracted Malaria , it was awful🤢 , if you’ve ever , then you know what I mean .Of course its such a common disease here, mostly in tropical areas, I dint have to get tested to know why am sick, quick run to the drug store for some quinine and healed 🥳 ,but that experience got me curious to know why malaria is still a life-threatening disease.
quick intro
After digging deep 🕵🏼♀️,I found that malaria is treatable and can be avoided by early detection of plasmodium parasites (the little sh*ts responsible for malaria🤬 ). There are many techniques for detection and microscopic diagnosis is the most common one which requires use of qualified microscopist who analyze microscopic blood smear images. This has its shortcomings , example, it takes a long time and its tiring for the expert who analyze many blood samples, especially in malaria infested areas. This leads to incorrect diagnostic decisions in the field causing excessive use of antibiotics in false-negative cases, second consultation, loss of working days, and, in some cases, progression to extreme malaria.
So why not optimize this technique by automating the diagnosis process , capturing the segmented cell images on the microscope and feeding them as inputs to a deep convolutional neural network then let the network do the classification? 🤷🏼♀️
That's exactly what we are going to do. Okay lets get into it

prerequisites
Familiarity with Pytorch framework , Python programming, Streamlit and Google colab.
Data collection and Preparation
Image data was sourced from Kaggle , and stored in google drive, a total of 27,563 images of both infected and uninfected cell images. The images were label encoded into two classes , 0 for Malaria and 1 for Nomalaria.

The data was then split into train and test sets with a 90:10 ratio split, and saved into separate csv files.
Data augmentation was performed on both splits by importing transforms class in torchvision ,import torchvision.transforms as transforms , which includes normalizing and converting to tensors . Train data was further randomly split into train and validation sets in a 80:10 ratio then loaded into Dataloaders in batches of 20 images a batch.
A sample of the train set was then visualized after the transformation by first converting the images to tensors and plotting one batch (20 images).

Network Architecture
Torchvisions models class has a couple of pretrained networks that can be used for transfer learning. The network used was a pretrained VGG-16 network.
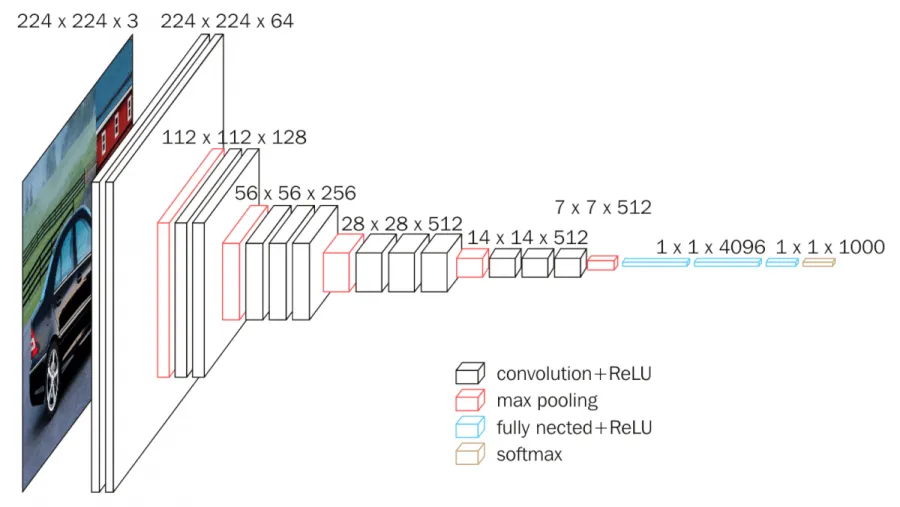
VGG16 has a total of 16 layers deep, 13 convolutional layers and 3 fully connected layers , with additional activation, pooling placed after every convolutional layer and drop out layers after fully connected layers to reduce the number of trainable parameters.
To access the network , I imported the models class and set pretrained to true,
from torchvision import models
vgg16 = models.vgg16(pretrained=True)
model = vgg16
Since network is pretrained ,next is to freeze the parameters so as not to backpropagate through them . It is important to note that vgg16 was trained on the ImageNet dataset which consists over 14 million images to classify 1000 classes and we want to classify 2 classes , malaria and Nomalaria so I went ahead and modified the vgg16 classifier by adding an extra layer of fully connected neural network, ReLU and drop-out layer .
The last fully connected layer , fc4, now outputs scores of 2 classes instead of original 1000 classes. My loss function of choice was Crossentropy loss which combines LogSoftmax and NLLLoss in one single class, meaning I dnt have to add a softmax layer in my network architecture. Stochastic gradient descent was my optimizer with a learning rate of 0.001 ,(arrived at after various fine tunings trying to get the ideal weights to increase model accuracy)
#Specify Loss Function and Optimizer
#loss function
criterion = nn.CrossEntropyLoss()#optimizer
import torch.optim as optim
optimizer = optim.SGD(model.parameters(), lr=0.001)
Model Training
Model network was trained for 50 epochs , with training and validation accuracy and loss output after every epoch. Test set stayed unknown to the model and will be used later for inference.
Accuracy and loss were the evaluation metrics. Accuracy checks how accurate the model is by comparing the true labels of the images to the outputs predicted by the model , it then calculates how many have been correctly classified over the total number of labels/targets , when multiplied by 100% you get the percentage accuracy. Loss checks how many images were incorrectly classified /predicted and updates the model weights to minimize loss. The lower the loss the better the model performs.

Model was saved every time the validation loss decreases to make sure we have an optimum model with lowest loss and highest accuracy.
The train and validation loss and accuracy were writing into a tensorboard and produced the graphs shown in the figure below. It is clear that my model was not overfitting or underfitting for that matter with how steady and somewhat smooth the curves appear and the closeness of the train accuracy 0.86 and validation 0.88.

Inference
inference provides a clear judgement on whether my model is able to accurately make predictions on data it has not seen before and how it will perform with real world data.
Test set is hidden from model during training and contained about 2757 images that were used to test if the model has trained well enough to make accurate predictions on new data. When evaluating model with test set the only forward propagation is carried out to prevent model from updating the parameters/weights so model has to be set to eval , model.eval() .

Model had a test loss of 0.25 which is relatively low .
It is also clear that the model predicts uninfected cell images better , with a 93% accuracy of correctly predicting cells with Nomalaria and 85% of accurately predicting cells with malaria.
Overall accuracy is 89% which is better than the training and validation accuracy. The model seems to be performing well and not overfitting.
The model was deployed to an interactive web based application built on Streamlit and hosted by Ngrok.
disclaimer : It currently runs locally on my machine in Google Colab because of the free GPU access that gives faster predictions.
If you want to check it out or recreate this project here is the colab notebook with the source code .
The interface should be as shown .


Once you hit the diagnose button, you should have Aria’s predictions displayed as shown . When the label matches the prediction a success bar is shown and when they don’t match a warning bar is shown.
This project, even though basic ,shows that we can leverage AI technology, which is Computer vision for image classification , and use it to automate the process of diagnosing malaria with exceptional results. More research and development needs to be done to even make it possible for clinical testing ,but we have to start somewhere right?
Authors note : For questions and inquires here is my email address: clozymwangs@gmail.com .
Lets connect on linkedin
