Dan LarsonDan’s Data Dive — Week 2The past month I have been diving into the ever-evolving world of generative AI. I have been reading a lot about training my own LLM…3 min read·Jul 31, 2023----
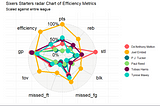
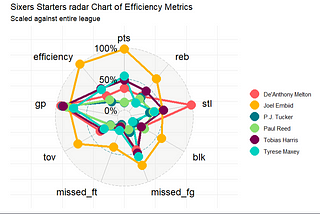
Dan Larson5 Ways to Enhance Your GGPLOT VisualizationsGGplot2 is a powerful data visualization package in R and has become a popular choice among data scientists and analysts for creating…7 min read·Jul 19, 2023----
Dan LarsonDan’s Data Dive: Week 1Welcome to the inaugural edition of our weekly blog series, where I’ll be documenting my journey developing data science tools! Don’t…3 min read·May 17, 2023----
Dan LarsonAnalyzing NBA Statistics with DuckDBData analysis is vital for extracting insights and making informed decisions, even in sports. The NBA generates vast amounts of data that…7 min read·May 15, 2023----
Dan LarsonUsing the R and the Tidyverse to analyze Joel Embiid’s Player StatsJoel Embiid is a professional basketball player from Cameroon who currently plays as the center for the Philadelphia 76ers of the National…6 min read·Feb 5, 2023----
Dan LarsonFive articles that had me thinking in 2022So much happened in 2022 in the Data Science/Engineering/AI space that I can’t really keep track. Some of the biggest news included…4 min read·Jan 12, 2023----
Dan LarsonThree data tools I am going to learn more about 20232022 was a pretty exciting year in Data. The field of data engineering really took off and everyone is asking how it relates to data…4 min read·Jan 2, 2023--1--1
Dan LarsonThree SQL Techniques to add to your toolkitIMHO, SQL is one of the most important technical skills for data engineers, scientists and analysts to develop. I have spent countless…4 min read·Dec 29, 2022----
Dan LarsonBlue Christmas Part 2- Using Tidytext to calculate the sentiment of Christmas Song LyricsIn this series, I am reproducing the 2017 blog post-Blue Christmas by Caitlin Hudon. In the first part, I pulled and analyzed the Spotify…5 min read·Dec 21, 2022----
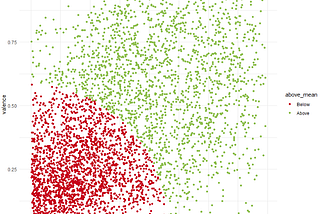
Dan LarsonThree ggplot2 visualization techniques for displaying distributionsIt is important to visualize the distribution of data. First and foremost, it helps us to understand the data and identify patterns and…4 min read·Dec 14, 2022--1--1