Dan McCareyinMaptianGerm City: Mapping Cholera in NYCOur Mapping Cholera data visualization is currently on display at the Museum of the City of New York as part of the Germ City: Microbes…Jan 24, 2019Jan 24, 2019
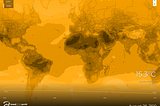
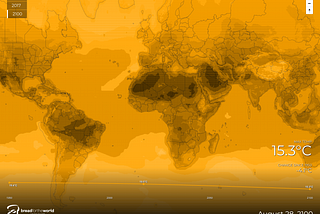
Dan McCareyinMaptianVisualizing Near Surface Air Temperature in 2100In the wake of the United Nation’s latest climate change report released last month, I wanted to write about our process in creating this…Nov 12, 2018Nov 12, 2018
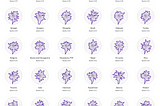
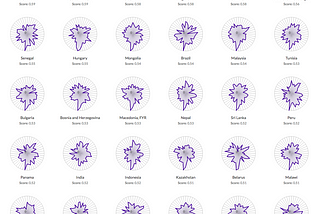
Dan McCareyinMaptianVisualizing the Rule of LawWe recently worked with the World Justice Project to update the Rule of Law Index. The Rule of Law Index tracks how the rule of law is…Feb 6, 20181Feb 6, 20181
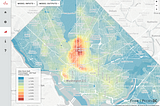
Dan McCareyinHi.StamenDC is trippin! with this new data visualization transportation toolWe recently launched a new tool with transportation consultants Fehr & Peers and the District Department of Transportation (ddot). TripsDC…Nov 14, 20171Nov 14, 20171