Machine learning classification for forex market
“Have you never thought to a trading day session as … a flower?”
Well, when I proposed such subject during a brainstorming developement meeting I saw most of the participants mumbling and wondering which flowers I could have smoked or eaten: anyway, I was not kidding them and let me explain why.
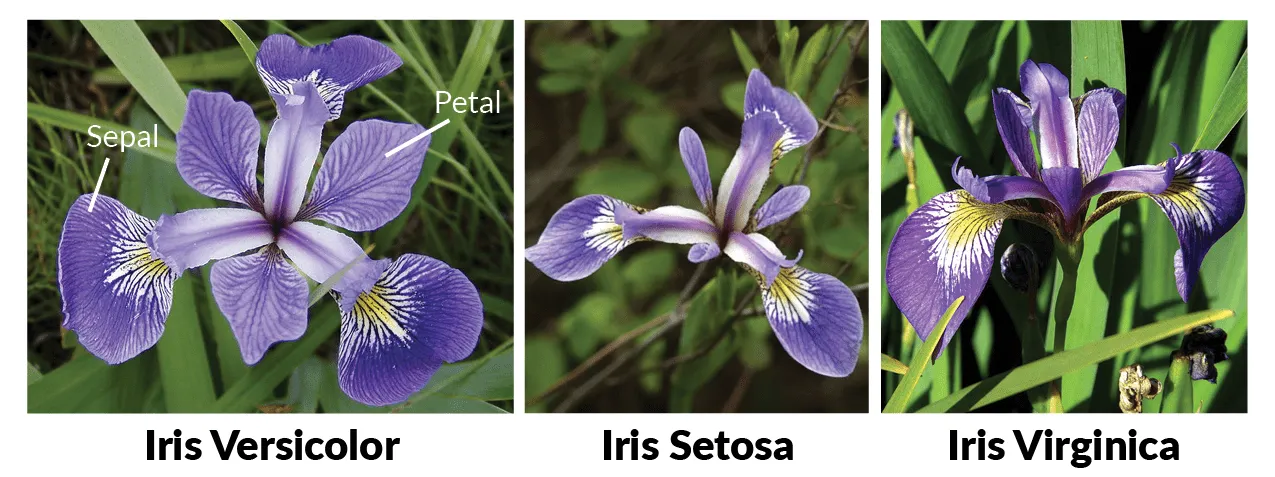
Let’s go back to 1936 when a British scientist named Ronald Fisher developed some kind of “algorithm” to recognize iris species starting from a few numerical data features. His studies and datasets are still used today for Artificial Intelligence classification model development.
Fisher used 4 features: sepal length, sepal width, petal length, petal width to recognize the 3 iris species (Setosa, Versicolor, Virginica).
So, what If we classify trading days in 4 species (or Patterns) such as:
1. Higher High Low
2. Lower High Low
3. Inside
4. Outside
and instead of petals and sepals we use price information of the previous days?

When look at price charts many experienced traders don’t try to predict the future looking at the past but to recognize incomplete patterns before their completion.
So, my idea was to use forex crosses daily prices (o,h,l,c) with the purpose to recognize price patterns with highly prediction accuracy in order to place long short trades before the pattern completion. Did it make sense?
Let’s go to Python

Import our libraries,

Load our 20 years USDJPY dataset

For the purpose of this article let’s engineer out model target just with ‘next day with higher High’.
Let’s train the model on in-sample data (X) and test it on out-of-sample data (X_oos)
Confusion matrix
Again, when I started talking about confusion matrix, my non-data scientists audience started grinning, maybe because still remembered my initial question about flowers, but anyway, this is our customized confusion matrix based on scikit-learn output:

Machine learning model evaluation
There are 3135 out-of-sample days (from 2011 to 2023).
1261 days showed the pattern and the model was able to predict 801 of them (64%);
1874 days did not show the pattern and the model was able to predict 1517 of them (81%);
The total accuracy of the model is 74%..
Financial considerations
As the pattern is a Higher High we expect a 64% profitablity if we go long at market close and take profit on the day High.
At the same time we expect a 81% profitability if we go short when the model predicts a no new High day but we need to take into account other intraday considerations.
Conclusion
Can we think of a trading day as a flower? We can say yes, because a trading patterns can be represented by a binary combination exactly like an iris species.
Is this machine learning model good? We can say yes, because apparently the accuracy is high. Anyway, in some next articles we are going deeper into the cross validation and features evaluation process.
Can we use this model to make real money? Unfortunately we actually don’t know the answer without a back-testing; this is what we are going to do in the next articles, maybe using some useful tools we create to let Python communicate with Tradestation.
