How I Transformed Netflix’s Decline into a Story You Can SeeSeeing Beyond the Graph: How to Critique Visual Data Effectively Dec 26, 20241Dec 26, 20241
Why you should visualize the data before doing anything else?We all know data is abundant, and making sense of it is crucial for informed decision-making. However, raw data, no matter how rich, can…Aug 10, 20232Aug 10, 20232
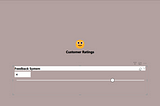
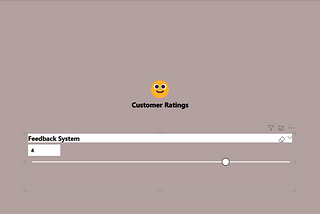
How to create a Feedback system in PowerBi?Setting up a feedback system in PowerBi reports using DAX (Data Analysis Expressions) involves creating calculated measures and columns to…Aug 5, 20231Aug 5, 20231