Emily StrandinUber MovementVisualizing micromobility patterns across cities with Movement’s New Mobility HeatmapToday, Uber launches the New Mobility heat map in nine cities across the globe: Brussels, Lisbon, London, Madrid, Paris, Rome, San…May 6, 2020May 6, 2020
Emily StrandVisualizing travel times in StockholmThis post is part of a series using Uber Movement to measure the impact of major events on traffic patterns. Uber Movement provides free…Jun 27, 2019Jun 27, 2019
Emily StrandinUber Under the HoodUber joins Urban Computing Foundation furthering commitment to building safer, smarter citiesBy: Emily Strand & Molly VorwerckMay 7, 2019May 7, 2019
Emily StrandinUber MovementSeasonal and major event travel time variability in BrusselsThis post is part of a series using Uber Movement to measure the impact of major events on traffic patterns. Uber Movement provides free…Apr 10, 2019Apr 10, 2019
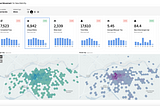
Emily StrandinUber MovementNewsroom post: New mobility dashboard for JUMP electric bikesBy Emily Strand and Jordan GilbertsonOct 25, 2018Oct 25, 2018
Emily StrandinUber MovementBringing more data to Uber Movement with street speedsBy Emily Strand and Jordan GilbertsonSep 26, 20182Sep 26, 20182
Emily StrandBringing more data to Uber Movement with street speedsBy Emily Strand and Jordan GilbertsonSep 26, 2018Sep 26, 2018
Emily StrandinUber Under the HoodBringing more data to Uber Movement with street speedsBy Emily Strand and Jordan GilbertsonSep 26, 2018Sep 26, 2018