Ian JohnsonVisualizing Monthly Retail Reports To Better Uncover InsightsFor data analysts and business leaders focused on the retail industry, being able to use data to effectively identify and forecast trends…2 min read·Sep 23, 2022----
Ian JohnsonMachine Learning for VisualizationLet’s Explore the Cutest Big Dataset12 min read·Sep 28, 2018--3--3
Ian JohnsoninDailyJSThe Trouble with D3Recently there were a couple of threads on Twitter discussing the difficulties associated with learning d3.js. I’ve also seen this come up…7 min read·Jun 12, 2018--14--14
Ian JohnsonThe Hitchhiker’s Guide to d3.jsThe landscape for learning d3 is rich, vast and sometimes perilous. You may be intimidated by the long list of functions in d3’s API…7 min read·May 12, 2017--13--13
Ian JohnsoninPrototyprUser Experience EngineeringI’ve just passed 6 months as a “User Experience Engineer” at Google and I’d like to share some things I’ve come to understand about the…5 min read·Mar 29, 2017--11--11
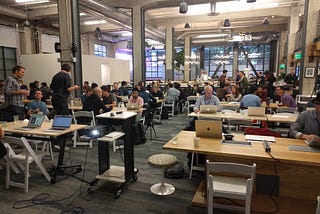
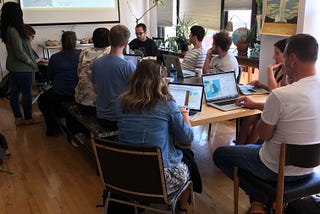
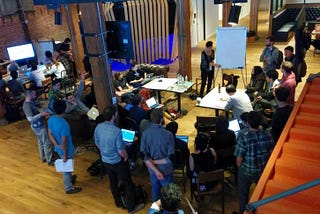
Ian Johnsond3.unconf(2016).recap()On October 16th one hundred d3.js practitioners gathered for two days of intensive sharing, learning and building at the 2016 d3.unconf. We…8 min read·Dec 31, 2016----
Ian JohnsoninHi.StamenWorking & Designing with Spatial DataLate this summer, 10 people gathered at Stamen Design’s studios to learn how to design and work with geospatial data on the web.4 min read·Oct 14, 2016----
Ian Johnsond3.unconf: What you can expectFor the third year in a row we are gathering together 100 d3.js practitioners to discuss, share and collaborate at the d3.unconf. The past…4 min read·Sep 15, 2016----
Ian JohnsoninHi.StamenAn ode to d3.js projectionsWhen it comes to making maps online there are many tools available, but they all have one thing in common: Geographic coordinates go in and…6 min read·May 30, 2016--4--4