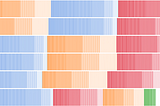
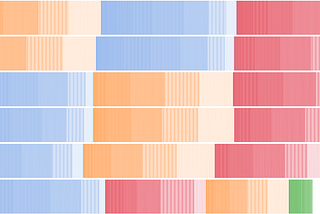
Etienne RamsteininTowards Data ScienceExperiments with treemaps and happy little accidentsIn my goal-oriented charts experiment, each item in the data set is represented by a little rectangle. Depending on what the user wants to…Sep 23, 2019Sep 23, 2019
Etienne RamsteinMaking the best use of interface elements in data visualizationSome tricks to maximize our data to pixel ratioSep 19, 2019Sep 19, 2019
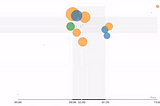
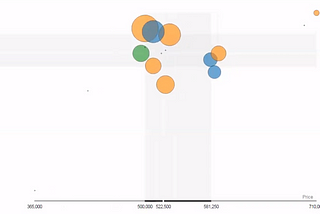
Etienne RamsteinGoal oriented data visualization tools, supported by object constancyWhen you build a chart in an application like Excel, the system asks you questions like “do you want a bar chart or a pie chart ?” and…Sep 19, 2019Sep 19, 2019
Etienne RamsteinAbout enriching semantic wikis with web componentsIn this series of posts, I’m going to discuss a knowledge management application I’ve prototyped this summer. It’s a semantic wiki that…Sep 18, 2019Sep 18, 2019
Etienne RamsteininThe StartupSemantic wiki with web components — Prototype DemoWith this prototype, I’m exploring how we can improve our knowledge management applications by combining the structure of database driven…Sep 18, 2019Sep 18, 2019