Haris MushtaqMap Generation through Matplotlib and GeoPandas using PythonThis article reflects on the creation of a map through a multi-polygon shapefiles by utilizing Python. Maps are essential for identifying…Jun 28Jun 28
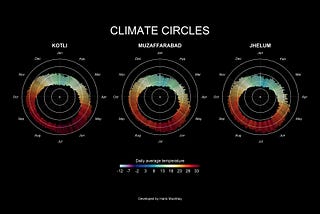
Haris MushtaqClimate Data Visualizations with R that Catch More AttentionClimate station data typically exists as time series, traditionally visualized through line plots. However, in certain scenarios — such as…Sep 24, 2023Sep 24, 2023
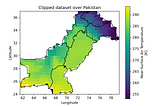
Haris MushtaqClip Netcdf data from shapefile using rioxarray and geopandasPython remains an invaluable tool for data visualization, renowned for its simplicity and efficiency in interpreting various data formats…Sep 23, 20231Sep 23, 20231