Create your professional widget in Flutter — Multiple Line Chart — (Part.1)
Motivation: I need to use a line chart to display tens of thousands of data points for my project. At first, I used the syncfusion_flutter_charts library, but I found that the trackball and scaling features became very slow when the data points exceeded 5000. Therefore, I created my own line chart widget which can handle more than 10000 data points as shown in the following video.
The performance comparison between my line chart (left) and syncfusion_flutter_charts 21.1.35 (right) is shown in the following video, you can see when the trackball moves forth and back quickly, my line chart can show corresponding tips in real-time, whereas syncfusion_flutter_charts is laggy.
In this tutorial, we will create a line chart using Flutter’s CustomPainter without using any third-party libraries. The X-axis will represent DateTime values and the Y-axis will represent double values.
We will add support for the following features:
- Draw more than one group of line series in a line chart.
- Horizontal scaling (pinch in / pinch out)
- Horizontal panning
- Draw a trackball containing a vertical line and corresponding data point on a long press event.
Let’s first take a look at how to draw basic elements such as X-axis, Y-axis, grids, and line series.
Step 1: Create the data structure to store chart data
Create a DateValuePairclass for the data point with a DateTime value and a double? value.
We use nullable double to handle null value and display blank points on the chart.
class DateValuePair {
  const DateValuePair({
    required this.dateTime,
    required this.value,
  });

  final DateTime dateTime;
  final double? value;
}
Step 2: Create a LineSeriesclass
The first step is to create a basic DateValuePairclass for each data point. This class will be responsible for holding a series of data points dataList and other additional properties such as line color, name, etc.
class LineSeries {
  const LineSeries({
    required this.name,
    required this.dataList,
    required this.dataMap,
    required this.startIndexes,
    required this.color,
  });

  final String name;
  final List<DateValuePair> dataList;
  final Map<DateTime, double?> dataMap;
  final List<int> startIndexes;
  final Color color;
}
Step 3: Create a LineChart Widget
This class will be responsible for receiving more than one group of line series inList<LineSeries> and preparing the necessary parameters for drawing.
For drawing the X-axis, we will calculate the farthest and nearest dates called _maxDate and _minDate, and the range between the farthest and nearest dates called_xRange
For Y-axis, we calculate the maximum _maxValueand minimum _minValue and the _yRange. You will notice that_minValue has subtracted a constant value of 10, and_maxValue has added a constant value of 10 as well, that’s because we want to prevent a range of 0 when all data points have the same value, which would cause the line series can not be drawn.
The _leftOffsetand _rightOffset make sure to leave some space on the left and right to prevent the chart from being drawn on the edge of the screen.
For handling hand gestures such as long press, pinch in or out, and panning, we need to know the offset _offsetXwhen we move the line series horizontally, we need to know the scale factor _scaleX when we pinch on it, and its position _longPressXwhen we long press on it.
We can get various gesture information by using GestureDetector so this class probably looks like this.
class LineChart extends StatefulWidget {
  final List<LineSeries> lineSeriesCollection;

  const LineChart({super.key, required this.lineSeriesCollection});

  @override
  LineChartState createState() => LineChartState();
}

class LineChartState extends State<LineChart> {
  double _leftOffset = 40;
  double _rightOffset = 60;
  double _longPressX = 0.0;
  double _offset = 0.0;
  double _scale = 1.0;
  double _minValue = 0.0;
  double _maxValue = 0.0;
  DateTime _minDate = DateTime.now();
  DateTime _maxDate = DateTime.now();
  double _xRange = 0.0;
  double _yRange = 0.0;

  @override
  void initState() {
    super.initState();
    List<LineSeries> lineSeriesCollection = widget.lineSeriesCollection;

    List<double?> allValues = lineSeriesCollection
        .expand((lineSeries) => lineSeries.dataMap.values)
        .toList();

    allValues.removeWhere((element) => element == null);

    List<double?> allNonNullValues = [];
    allNonNullValues.addAll(allValues);

    List<DateTime> allDateTimes = lineSeriesCollection
        .expand((lineSeries) => lineSeries.dataMap.keys)
        .toList();

    _minValue = allNonNullValues
            .map((value) => value)
            .reduce((value, element) => value! < element! ? value : element)! -
        10;
    _maxValue = allNonNullValues
            .map((value) => value)
            .reduce((value, element) => value! > element! ? value : element)! +
        10;

    _minDate = allDateTimes
        .map((dateTime) => dateTime)
        .reduce((value, element) => value.isBefore(element) ? value : element);
    _maxDate = allDateTimes
        .map((dateTime) => dateTime)
        .reduce((value, element) => value.isAfter(element) ? value : element);

    _xRange = _maxDate.difference(_minDate).inSeconds.toDouble();
    _yRange = _maxValue - _minValue;

  }

  @override
  Widget build(BuildContext context) {
    // define canvas width and height for drawing line chart
    double widgetWidth = MediaQuery.of(context).size.width;
    double widgetHeight = 200;

    return GestureDetector(
      onScaleStart: (details) {
        // handling scale factor
        // handling offset
      },
      onScaleUpdate: (details) {
        // handling scale factor
        // handling offset
      },

      onLongPressMoveUpdate: (details) {
        // handling the long press position
      },
      onLongPressEnd: (details) {
        // handling the long press position
      },
      onLongPressStart: (details) {
        // handling the long press position
      },
      child: CustomPaint(
        size: Size(
          widgetWidth,
          widgetHeight,
        ),
        painter:
          // implement line chart using CustomPainter
        ),
      ),
    );
  }
}
Step 4: Create a LineChartPainter widget
We will define our custom painter class that extends CustomPainter.
In this class, we can draw the following we need by using thecanvas
- Draw Y-axis labels and horizontal grid lines
- Draw a Y-axis
- Draw an X-axis
- Draw X-axis labels and vertical grid lines
- Draw line series
The class implementation prototype should look like this.
class LineChartPainter extends CustomPainter {
LineChartPainter({
required this.lineSeriesCollection,
required this.longPressX,
required this.leftOffset,
required this.rightOffset,
required this.offset,
required this.scale,
required this.minValue,
required this.maxValue,
required this.minDate,
required this.maxDate,
required this.xRange,
required this.yRange,
});
final List<LineSeries> lineSeriesCollection;
final double longPressX;
final double leftOffset;
final double rightOffset;
final double offset;
final double scale;
final double minValue;
final double maxValue;
final DateTime minDate;
final DateTime maxDate;
final double xRange;
final double yRange;
@override
void paint(Canvas canvas, Size size) {
double yStep = size.height / yRange;
// Draw Y-axis label and horizontal grid line
_drawYAxisLabelAndHorizontalGridLine(
canvas: canvas,
size: size,
yStep: yStep,
);
// Draw Y-axis line
_drawYAxis(
canvas: canvas,
size: size,
);
// Draw X-axis line
_drawXAxis(
canvas: canvas,
size: size,
);
double xStep = (size.width * scale - rightOffset) / xRange;
// Draw X-axis label and vertical grid line
_drawXAxisLabelAndVerticalGridLine(
canvas: canvas,
size: size,
xStep: xStep,
);
// Draw line series
_drawLineSeries(
canvas: canvas,
xStep: xStep,
yStep: yStep,
);
}
@override
bool shouldRepaint(LineChartPainter oldDelegate) {
return oldDelegate.longPressX != longPressX ||
oldDelegate.scale != scale ||
oldDelegate.offset != offset;
}
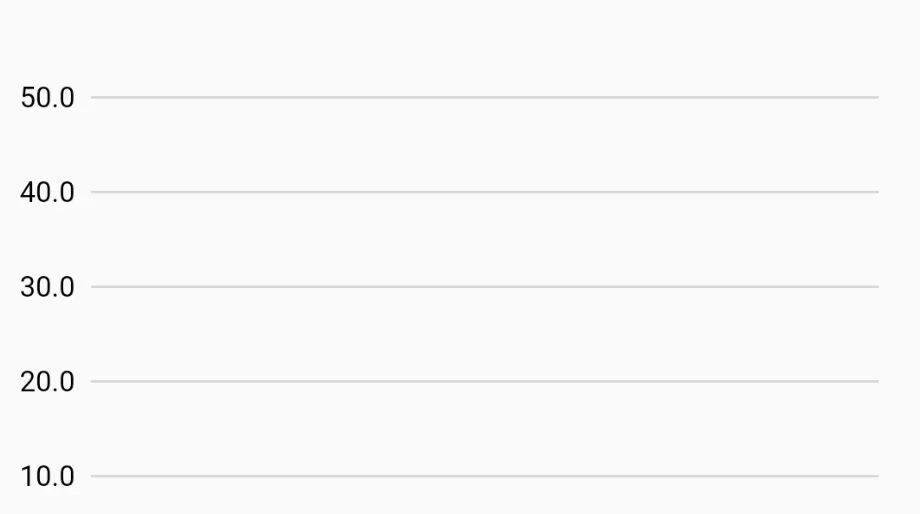
}Step 4–1: Draw Y-axis labels and horizontal grid lines
Before starting drawing, we need to know the Y-axis unit of the drawing area yStep which is used to map the yRange to the screen
double yStep = size.height / yRange;We have yScalePoints = 5 because we want to draw 5 scale points on the Y-axis, first, calculate the yInterval value by dividing the yRange by yScalePoints , and calculates the scaleY which is used to determine the y-coordinate of the horizontal grid line and the Y-axis label position.
  void _drawYAxisLabelAndHorizontalGridLine({
    required Canvas canvas,
    required Size size,
    required double yStep,
  }) {
    int yScalePoints = 5;
    double yInterval = yRange / yScalePoints;
    for (int i = 0; i < yScalePoints; i++) {
      double scaleY = size.height - i * yInterval * yStep;

      // Draw horizontal grid line
      canvas.drawLine(Offset(leftOffset, scaleY),
          Offset(size.width - rightOffset + leftOffset, scaleY), _gridPaint);

      // Draw Y-axis label
      String label = (i * yInterval + minValue).toStringAsFixed(1);
      _axisLabelPainter.text = TextSpan(
        text: label,
        style: const TextStyle(
          fontSize: 12,
          color: Colors.black,
        ),
      );
      _axisLabelPainter.layout();
      _axisLabelPainter.paint(
          canvas, Offset(10, scaleY - _axisLabelPainter.height / 2));
    }
  }
Suppose the canvas’s widgetWidth = 300, double widgetHeight = 200 , yRange = 50 , minValue = 10 , maxValue = 60 leftOffset = 40 ,rightOffset = 60
The 5 horizontal grid lines and labels will be:
grid line #0 (10, 200) to (280, 200), label #0 = 10
grid line #1 (10, 160) to (280, 160), label #1 = 20
grid line #2 (10, 120) to (280, 120), label #2 = 30
grid line #3 (10, 80) to (280, 80), label #3 = 40
grid line #4 (10, 40) to (280, 40), label #4 = 50
We don’t draw the maxValue = 60 here, you can do it by yourself if you are interested in it.
When we draw labels using _axisLabelPainter , the actual position will be lower than the expected position. thus, adjust each label position by subtracting_axisLabelPainter.height / 2 from the actual height
If you have your own data points, then it should be looks like this.
Step 4–2: Draw a Y-axis
Simply add a _leftOffset to the x-coordinate.
void _drawYAxis({
    required Canvas canvas,
    required Size size,
  }) {
    canvas.drawLine(
        Offset(leftOffset, 0), Offset(leftOffset, size.height), _axisPaint);
  }
Step 4–3: Draw an X-axis
Usually, we draw the x-coordinate from zero to the size.width, but in this case, we have leftOffset and rightOffset values, so we need to adjust the starting and ending x-coordinate accordingly.
  void _drawXAxis({
    required Canvas canvas,
    required Size size,
  }) {
    canvas.drawLine(Offset(leftOffset, size.height),
        Offset(size.width + leftOffset - rightOffset, size.height), _axisPaint);
  }

Step 4–4: Draw X-axis labels and vertical grid lines
We need to know the X-axis unit of the drawing area xStep , scale is scale factor when we pinch, considering you don’t scale line series is 1.0.
double xStep = (size.width * scale - rightOffset) / xRange;There is a key point here: since the starting point of the line series must be drawn on the right of the y-axis, we need to use canvas.translate to set the origin x-coordinate at the leftOffset + offset. offset is horizontal moving offset, considering you don’t move line series is 0.0.
We also consider setting the boundary for the line series by using canvas.clipRect to make sure the vertical grid line and its labels are unable to be drawn out of the bound when scaling up.
@override
  void paint(Canvas canvas, Size size) {
    // Draw Y-axis label and horizontal grid line
    double yStep = size.height / yRange;
    _drawYAxisLabelAndHorizontalGridLine(
      canvas: canvas,
      size: size,
      yStep: yStep,
    );

    // Draw X-axis line
    _drawXAxis(
      canvas: canvas,
      size: size,
    );

    // Draw Y-axis line
    _drawYAxis(
      canvas: canvas,
      size: size,
    );

    canvas.clipRect(Rect.fromPoints(Offset(leftOffset, 0),
        Offset(size.width + leftOffset - rightOffset + 1, size.height + 40)));

    // (left,top) => (leftOffset + offset,0)
    canvas.translate(leftOffset + offset, 0);

    double xStep = (size.width * scale - rightOffset) / xRange;

    _drawXAxisLabelAndVerticalGridLine(
      canvas: canvas,
      size: size,
      xStep: xStep,
    );
  }
The number of xScalePoints is dynamic because we want to handle scaling, every time we pinch in or out, we multiply the width on the scale factor and divide by a fixed number 80which means it will draw a scale point at every 80units in terms of screen range, then calculate the xInterval which is used to take one DateTimeat fixed intervals on average among all the data points, scaleX is used to determine the x-coordinate of the vertical grid line and the X-axis label.
We have to parse the DateTime value to display readable format on the X-axis label, displaying the complete date and time in this case.
void _drawXAxisLabelAndVerticalGridLine({
    required Canvas canvas,
    required Size size,
    required double xStep,
  }) {
    int xScalePoints = size.width * scale ~/ 80;
    double xInterval = longestLineSeries.dataList.length / xScalePoints;
    for (int i = 0; i < xScalePoints; i++) {
      double scaleX = (longestLineSeries
              .dataList[(i * xInterval).round()].dateTime
              .difference(minDate)
              .inSeconds
              .toDouble() *
          xStep);

      // Draw vertical grid line
      canvas.drawLine(
          Offset(scaleX, 0), Offset(scaleX, size.height), _gridPaint);
      // Draw X-Axis scale points
      DateTime dateTime =
          longestLineSeries.dataList[(i * xInterval).round()].dateTime;
      String date = DateFormat('MM/dd').format(dateTime);
      String time = DateFormat('HH:mm:ss').format(dateTime);
      _axisLabelPainter.text = TextSpan(
        text: '$date\n$time',
        style: const TextStyle(
          fontSize: 12,
          color: Colors.black,
        ),
      );
      _axisLabelPainter.layout();
      _axisLabelPainter.paint(canvas, Offset(scaleX, size.height));
    }
  }
Step 4–5: Draw line series
We draw each group of line series by iterating lineSeriesCollection , each lineSeries has List<DateValuePair> , draw every line segment between two adjacent points by iterating each DateValuePair .
for each DateValuePair data point, we calculate their position on the screen, The x-coordinate, we calculate the difference between the date and the nearest date, then multiplied it by xStep.
For the y-coordinate, we calculated the difference between the maximum value and the value, then multiplied it by yStep. (You can also get the y-coordinate by using canvasHeight — (data[i].value! — minValue)*yStep). don’t forget to subtract from canvasHeight because the y-coordinate on the screen increase as the position moves down, while the Y-Axis value increase as the position moves up.
As mentioned earlier, our DateValuePair defined double? that can accept null value, so we need a List List<int> startIndexes to record which data points have value but the previous value is null and records their indexes. When drawing, we first find the starting point of the line series and move the linePath to that position, so the line segment will not draw from (0,0) coordinate.
  void _drawLineSeries({
    required Canvas canvas,
    required double xStep,
    required double yStep,
  }) {
    for (LineSeries lineSeries in lineSeriesCollection) {
      List<DateValuePair> data = lineSeries.dataList;
      List<int> startIndex = lineSeries.startIndexes;
      Path linePath = Path();

      Paint linePaint = Paint()
        ..color = lineSeries.color
        ..strokeWidth = 2.0
        ..strokeCap = StrokeCap.round
        ..style = PaintingStyle.stroke;

      // find the first non null value
      int firstIndex = data.indexWhere((element) => element.value != null);

      for (int i = firstIndex; i < data.length - 1; i++) {
        double currentScaleX =
            (data[i].dateTime.difference(minDate).inSeconds * xStep);
        double? currentScaleY =
            data[i].value == null ? null : (maxValue - data[i].value!) * yStep;

        if (currentScaleY != null) {
          if (i == firstIndex) {
            linePath.moveTo(currentScaleX, currentScaleY);
          }

          // if previous index of value is null, Do not draw line near the point
          if (startIndex.contains(i)) {
            linePath.moveTo(currentScaleX, currentScaleY);
          } else {
            linePath.lineTo(currentScaleX, currentScaleY);
          }
        }
      }

      canvas.drawPath(linePath, linePaint);
    }
  }
Now, we are able to draw line series, suppose we have a bunch of data point in json format as below:
List jsonData1_1 = [
  {"time": "2022-09-16 00:01:39", "value": "26.4"},
  {"time": "2022-09-16 00:11:39", "value": "26.4"},
  {"time": "2022-09-16 00:21:40", "value": "26.5"},
  {"time": "2022-09-16 00:31:38", "value": "26.7"},
  {"time": "2022-09-16 00:41:38", "value": "null"},
  {"time": "2022-09-16 00:51:39", "value": "null"},
  {"time": "2022-09-16 01:01:38", "value": "null"},
  {"time": "2022-09-16 01:11:38", "value": "null"},
  {"time": "2022-09-16 01:21:38", "value": "26.9"},
  {"time": "2022-09-16 01:31:38", "value": "26.9"},
  {"time": "2022-09-16 01:41:38", "value": "26.9"},
  {"time": "2022-09-16 01:51:48", "value": "27.0"},
  {"time": "2022-09-16 02:01:39", "value": "null"},
  {"time": "2022-09-16 02:11:39", "value": "null"},
  {"time": "2022-09-16 02:21:39", "value": "27.4"},
  {"time": "2022-09-16 02:31:38", "value": "27.4"},
  {"time": "2022-09-16 02:41:39", "value": "27.3"},
  {"time": "2022-09-16 02:51:38", "value": "27.2"},
  {"time": "2022-09-16 03:01:41", "value": "27.3"},
  {"time": "2022-09-16 03:11:38", "value": "27.4"},
  {"time": "2022-09-16 03:21:38", "value": "27.4"},
  {"time": "2022-09-16 03:31:37", "value": "27.4"},
  {"time": "2022-09-16 03:41:38", "value": "27.4"},
  {"time": "2022-09-16 03:51:40", "value": "27.4"},
  {"time": "2022-09-16 04:02:10", "value": "27.3"},
  {"time": "2022-09-16 04:11:41", "value": "27.2"},
  {"time": "2022-09-16 04:21:38", "value": "27.3"},
];
With the preprocessing method, we put all data points into LineSeries .
  LineSeries _getChartData({
    required List data,
    required Color color,
    required String name,
  }) {
    List<DateValuePair> dataList = [];
    Map<DateTime, double?> dataMap = {};
    List<int> startIndexes = [];
    for (int i = 0; i < data.length; i++) {
      var d = data[i];
      DateTime dateTime = DateTime.parse(d['time'].toString());
      double? value =
          d['value'] == 'null' ? null : double.parse(d['value'].toString());

      dataList.add(DateValuePair(dateTime: dateTime, value: value));
      dataMap[dateTime] = value;

      if (i > 0) {
        if (value != null && dataList[i - 1].value == null) {
          startIndexes.add(i);
        }
      }
    }

    LineSeries lineSeries = LineSeries(
      name: name,
      dataList: dataList,
      dataMap: dataMap,
      startIndexes: startIndexes,
      color: color,
    );

    return lineSeries;
  }
The line series contain null values, it should be drawn as below.

Try to put more data points!!

We already define a good data structure List<LineSeries> so that we can draw many groups of line series on one chart.

Next part, We will continue to introduce how to implement horizontal scaling (pinch in / pinch out), horizontal panning, and drawing a vertical line and corresponding data point on a long press event.
For the complete code, please refer to