Ford GoBike System Data project

This project is my final ALX-T Udacity project and I will share with you my Exploratory analysis and Explanation analysis of the bike-sharing system covering the greater San Francisco Bay area. This data set includes information about individual rides made.

Data Wrangling
Following the Data Wrangling method, I started by Gathering the dataset from its source. The dataset was limited to just SanFransisco though I could also get for other cities. The dataset is gotten from here.
In the Assess stage of the data wrangling steps, I noted some rows and columns where the data lacked accuracy, completeness, consistency, and reliability. As the dataset is meant to be of quality.
Some of which are:

The method taken to clean this data is the Define, Code, and Test. That is I start by stating the error in the dataset, then I code the correction, and finally, Test if it's corrected.

This method is best for me as it monitors every error and progress taken to correct them.
Exploration
After the cleaning process, the next is to explore and see what relationships and insights I could generate from the data. Some of the insights required additional columns which had the daytime which rides were taken most.

The plots of my exploration are split into Univariate, Bivariate, and Multivariate plots.
For the Univariate, I saw:
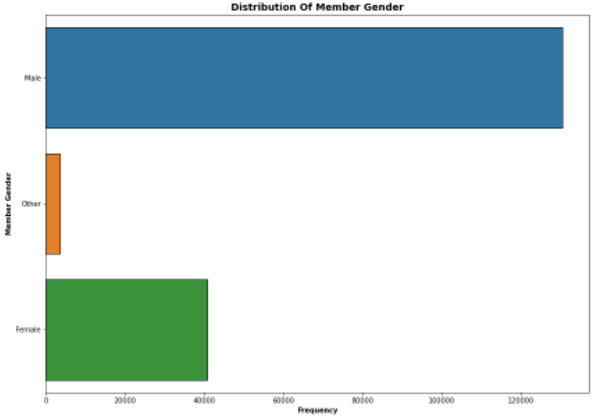
- What gender made use of the service most
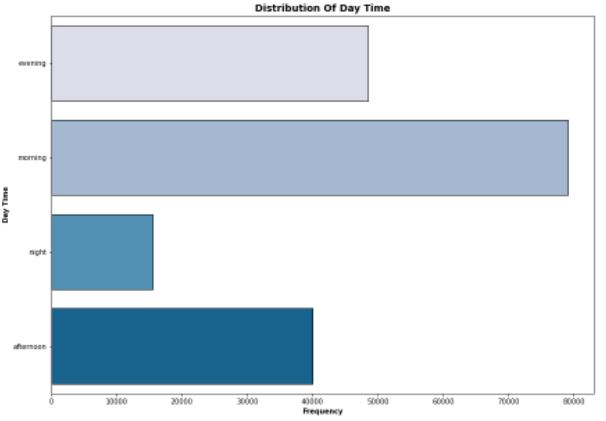
- What time of the day were the rides mostly taken and so on
For the Bivariate, I saw:
- What relationship is between the members_age and the duration which they ride
- What station is mainly used and what time of the day are they mostly used
For the Multivariate, I saw:
- The rides for the top 10 stations using a FacetGrid
In total, I made over 18 exploration plots to see the relationships that exist and generate insights from this data. I saved the cleaned and explored data after I was satisfied with all the exploration made. Next is the Explanation!
Explanation
The Explanation analysis was done on a different notebook and only selected insights were shared, some of which are:
- The gender that made use of the service mostly
- What time of the day do we have most rides
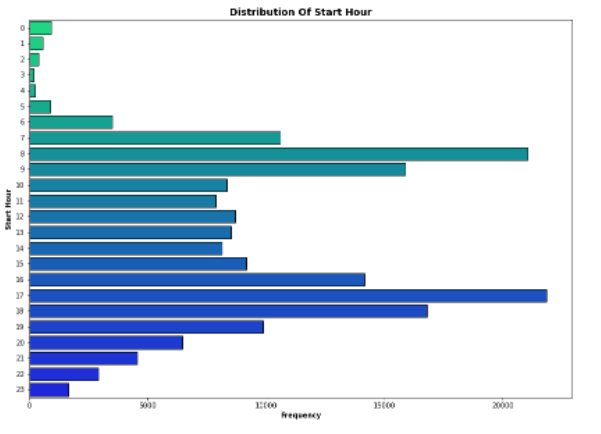
- What particular hour of the day do we have most rides
These were done amongst others.
The insights generated are shown thus:
What hour of the day was most rides?
As seen in the visuals, the Male gender makes use of the cycling services the most.
Also, the morning and the evening are when people use the services. This could hint to us that majority of the population are employed or students.
To add to that, we see the hours in which most of these rides are made.
In conclusion, this project is my capstone Data Analytics course by ALX-T Udacity. It’s been a beautiful learning experience.
You can check my GitHub for the whole analysis
And you can follow me up on LinkedIn
