Isaac NeuhausinStackademicData Analytics and Network Graphs in Python, R, or a Simple Web PageNetwork graphs are essential in biology to visualize complex systems and understand the relationships between biological entities. These…Sep 7, 20231Sep 7, 20231
Isaac NeuhausinStackademicUsing ggplot in R, Python and JavaScriptAs scientists, we continuously engage in research and analysis across diverse environments. This requires not only proficiency in multiple…Aug 8, 20232Aug 8, 20232
Isaac NeuhausinDev GeniusWhere is the data?One of the most frustrating issues for a data scientist is finding the raw data used in any visualizationSep 23, 20221Sep 23, 20221
Isaac Neuhauscxplot: the ggplot of JavaScriptCxplot is a wrapper for CanvasXpress that implements the same grammar as that one used by the ggplot R package. Cxplot is a standalone…Feb 3, 2022Feb 3, 2022
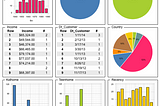
Isaac NeuhausDashboards in 30 seconds with CanvasXpressWritten by Jonathan Neuhaus and Isaac NeuhausOct 15, 2021Oct 15, 2021