The first full quarter since the start of the pandemic has passed, and RateSetter and its lenders have made it out the other side unscathed….for now!
While the lending rates ran crazy for a while and the invocation of the 1-month access queue caused concern among lenders, at this point, peer-to-peer lending in Australia remains strong.
This post is a review of the rollercoaster ride that was Q2.
As always, let’s get one thing out of the way from the start. RateSetter does not endorse this post and it should not be understood as financial advice of any kind! I am merely a peer to peer investor and care about my RateSetter loans.
Credit to their strong commitment to open data, RateSetter regularly publish their loan book and this has been the basis of this post.
If you are interested in my older posts or in getting access to your personalised lender dashboard, visit peerlenderinsights.com.au.
Clearing of access queue
For lenders, the recent quarter finished with positive news. In early April at the height of uncertainty in all markets, a 1-month access queue was invoked for the first time which saw funds in the short term market committed beyond the indicative term. While this was legitimate and always outlined in RateSetter’s PDS, it’s fair to say it caught a lot of lenders by surprise. The inevitable distress and uncertainty it caused was evident in various online forums and in the focus of questions asked in RateSetter’s webinars in May.
To the delight of lenders, the access queue cleared in early June.
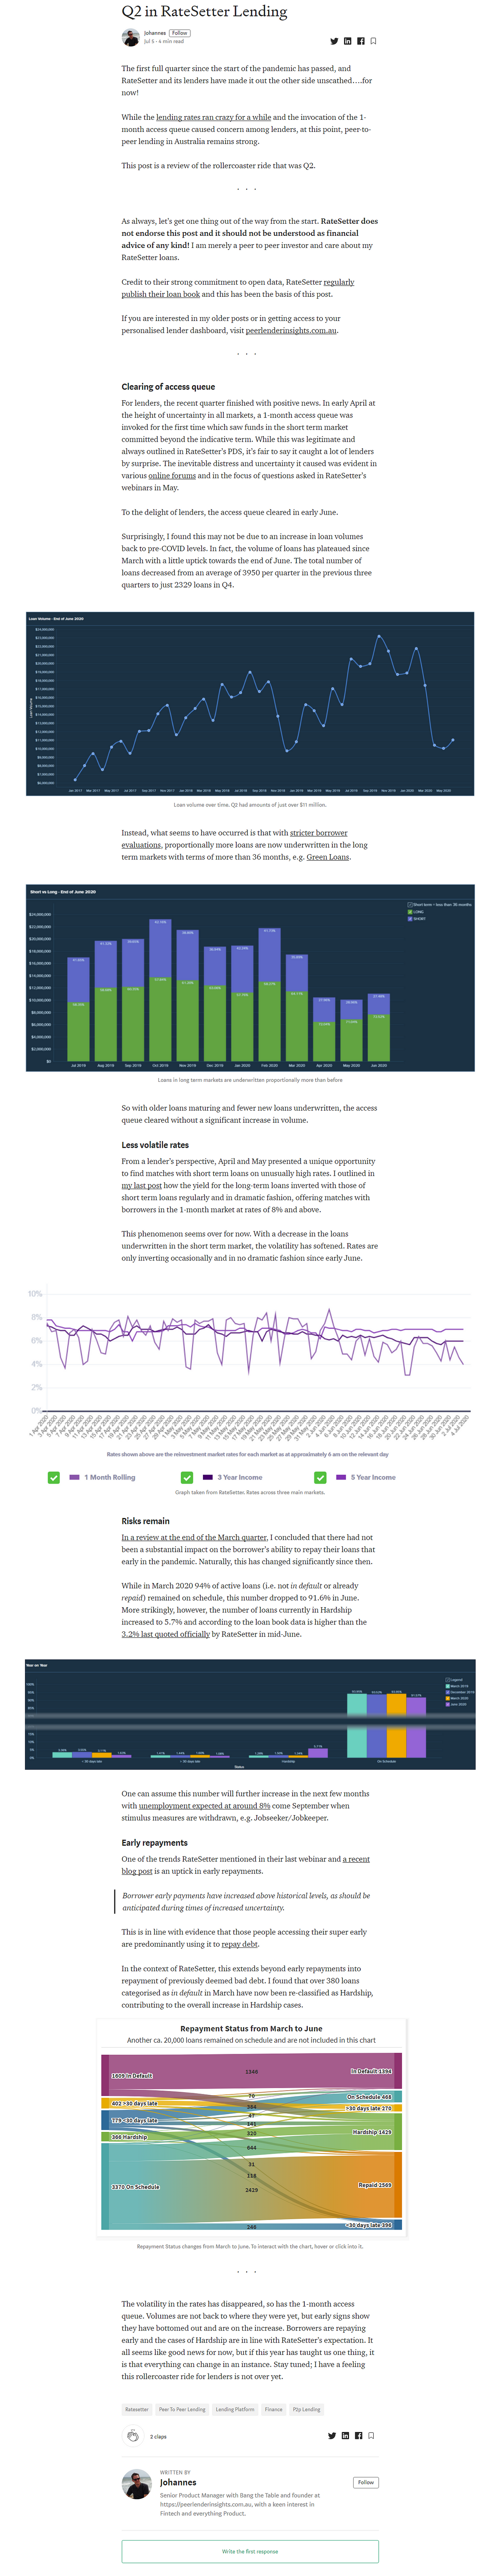
Surprisingly, I found this may not be due to an increase in loan volumes back to pre-COVID levels. In fact, the volume of loans has plateaued since March with a little uptick towards the end of June. The total number of loans decreased from an average of 3950 per quarter in the previous three quarters to just 2329 loans in Q4.

Instead, what seems to have occurred is that with stricter borrower evaluations, proportionally more loans are now underwritten in the long term markets with terms of more than 36 months, e.g. Green Loans.

So with older loans maturing and fewer new loans underwritten, the access queue cleared without a significant increase in volume.
Less volatile rates
From a lender’s perspective, April and May presented a unique opportunity to find matches with short term loans on unusually high rates. I outlined in my last post how the yield for the long-term loans inverted with those of short term loans regularly and in dramatic fashion, offering matches with borrowers in the 1-month market at rates of 8% and above.
This phenomenon seems over for now. With a decrease in the loans underwritten in the short term market, the volatility has softened. Rates are only inverting occasionally and in no dramatic fashion since early June.

Risks remain
In a review at the end of the March quarter, I concluded that there had not been a substantial impact on the borrower’s ability to repay their loans that early in the pandemic. Naturally, this has changed significantly since then.
The number of loans in Hardship increased to almost 3%, more than doubling from the previous period and in line with RateSetter’s last provision fund update in June. The amount of loans On Schedule, however, remain at a very solid 93.6%, similar to previous quarters.

One can assume the number of Hardship cases will further increase in the next few months with unemployment expected at around 8% come September when stimulus measures are withdrawn, e.g. Jobseeker/Jobkeeper.
Early repayments
One of the trends RateSetter mentioned in their last webinar and a recent blog post is an uptick in early repayments.
Borrower early payments have increased above historical levels, as should be anticipated during times of increased uncertainty.
This is in line with evidence that people accessing their super early are predominantly using it to repay debt.
In the context of RateSetter, this extends beyond early repayments into repayment of previously deemed bad debt. I found that over 263 loans categorised as In Default in March have now been repaid, with another 50 moving from Hardship to Repaid.
The volatility in the rates has disappeared, so has the 1-month access queue. Volumes are not back to where they were yet, but early signs show they have bottomed out and are on the increase. Borrowers are repaying early and the cases of Hardship are in line with RateSetter’s expectation. It all seems like good news for now, but if this year has taught us one thing, it is that everything can change in an instance. Stay tuned; I have a feeling this rollercoaster ride for lenders is not over yet.
CORRECTION ON 11 JULY 2020: The RateSetter team have informed me about an error in the originally published loan book, leading to an inflated number of loans categorised as Hardship. An updated loan book has been published.

I have made corrections in the text to reflect the update.
The original article can be found on the left or by clicking here.
