Jawaad FarooqExploring Seaborn’s plotting capabilities — looking at 11 years of temperature data.Seaborn is a package that allows you to visualise statistical plots using matplotlib. It is very fast to use and has a nice interface and…Aug 7, 2017Aug 7, 2017
Jawaad FarooqLooking at the datasetThe dataset begins at 1750 -01–01 and ends on 2015–12–01 with one reading every month on the first day of the month. The global…Aug 2, 2017Aug 2, 2017
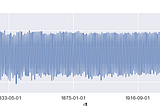
Jawaad FarooqPlotting Average Global TemperaturesThe following plot is a line graph of the average land surface temperatures since 1750. It is a crude graph built using Pandas inbuilt…Jul 29, 2017Jul 29, 2017
Jawaad FarooqFollowing my Journey in learning about Data Science…Follow my data science journey as I blog about all the things I’ve learnt and publish them here. I’ve just started out in learning about…Jul 26, 2017Jul 26, 2017