Asleep at the Wheel: A Computer Vision and Deep Learning Approach to Detecting Drowsiness
This article is a comprehensive overview of implementing Computer Vision and Deep Learning concepts to detect drowsiness of a driver and sound an alarm if drowsy.
Authors: Jaynish Vaghela, Sunny Bhagia, Sepand Farghadani,Omid Meh, Melanie
Github repository: https://github.com/jaynishvaghela/DriverDrowsinessDetection
https://github.com/omidmeh/AsleepAtTheWheel
Introduction
Driving while drowsy is a serious and often tragic problem in the United States. A report from the National Highway Traffic Safety Administration estimates that drowsy driving leads to 100,000 police-reported crashes each year, 71,000 injuries and 800 fatalities, and a $12.5 billion cost. The National Sleep Foundation reported that 37 percent of people admitted to falling asleep behind the wheel. Young adults between the ages of 18–29 are are even more likely to drive when drowsy, with a reported 71 percent compared to approximately half of those in the age range 30 to 64.
A solution to this problem is to identify when a driver is falling asleep, and alarm the driver and passengers of the situation so that appropriate measures can be taken.
In this work we propose two image-based frameworks for the detection and recognition of drowsiness based on a video feed of the driver’s face. Both frameworks are broadly divided into two parts, namely, feature extraction followed by time series based prediction. The two frameworks differ in the way features are extracted and fed into an LSTM (Long Short Term Memory) Network to make predictions. The model aims to monitor a driver’s condition in real-time. From the video, an image-based noninvasive technique is used to detect the facial features of the driver with time and classify drowsiness (Alert or Drowsy) and sound an alarm if drowsy.
Existing Solutions
Technologies in drowsiness detection can be classified into three main categories:
- The first category involves measuring cerebral and muscular signals and cardiovascular activity. These techniques are invasive and not commercially viable.

2. The second category includes techniques of measuring overall driver behavior from the vehicle patterns. These techniques do not work with micro-sleeps (driver falls asleep for a few seconds) since measuring many of these parameters requires a significant amount of time and user data.

3. The third category consists of using Computer Vision techniques as a non-invasive way to monitor the driver’s sleepiness.

Dataset
The videos used in this work come from The University of Texas at Arlington Real-Life Drowsiness Data set (UTA-RLDD). This set of videos is the largest to date realistic drowsiness data set. It includes self-recorded videos from 60 healthy participants. Each participant recorded three videos representing three alertness classes labeled by the participant based on their predominant state while recording each video.
- Alert: Completely conscious and able to drive for long hours
- Low Vigilant: some signs of sleepiness but no effort to keep alert, driving would be discouraged
- Drowsy: Subject needs to actively try not to fall asleep
The total set thus includes 180 videos, each about 10 minutes long, and all under 30 fps.
This data set includes a diverse group of subjects. Participants were undergraduate students, graduate students, or staff members over 18 years old, from 20 to 59 with a mean of 25 and a standard deviation of 6 years. There were 51 men and 9 women, including a wide range of ethnicities ( 10 Caucasian, 5 non-white Hispanic, 30 Indo-Aryan and Dravidian, 8 Middle Eastern, and 7 East Asian). The videos also represented those with eye wear in 21 of the 180 videos and those with considerable facial hair in 72 out of 180 videos.
Baseline Model
Using this data set, UTA uses a model that first extracts blink related features, including blink duration, amplitude, and eye opening velocity. These hand-crafted features are then fed into a Hierarchical Multiscale LSTM to leverage the temporal pattern of calculated blink features. The issue with this model is that it relies on hand-crafted blink features rather than an end-to-end learning system. This work also ignores many informative facial cues that signal drowsiness.

Here we propose two models that aim to leverage a larger set of facial cues that indicate drowsiness. For this initial phase we used a subset of these videos, selecting the extreme classes “alert” and “drowsy” from six to eight of the total participants.
Model A: Facial Feature Engineering (FFE)
Several facial features give clear cues to whether or not someone is drowsy. The eyes give cues such as increased, or prolonged blinking. The mouth shows signs by yawning, or drooping. Even the position of the head can indicate drowsiness if it is drifting downward or bobbing frequently. These are all signs and indications that humans perceive as drowsiness. However in the context of AI drowsiness detection the cues are often limited to blink detection alone.
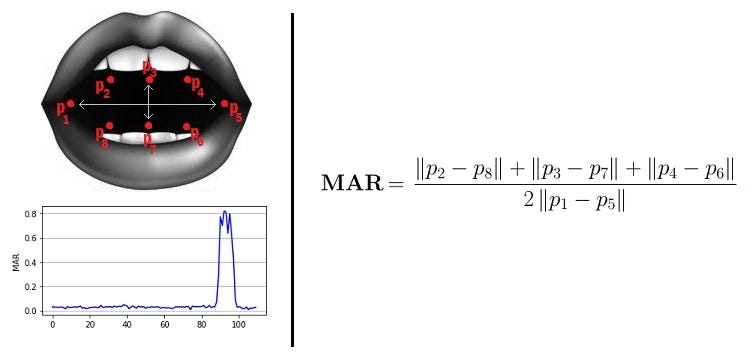
In this approach, we propose using the position of key facial features, including the eyes, nose, mouth, and chin, as well as the eye-aspect ratio (EAR), and mouth-aspect ratio (MAR) to detect drowsiness. The importance of these features are learned as a time series within a sequential model.


To extract the features, a subset of 16 videos were selected from the 180 videos in the RLDD. This subset represents the drowsy and alert case for eight participants. Each frame of the video could then be used as an image to extract the x,y coordinates of 68 facial features. These feature coordinates were reduced to 24 features: The edges of the eyes, the outer lips, the tip of the nose, and the tip of the chin. These features were selected to provide information on blinking, yawning, and the movement of the head, while minimizing the size of the input. From the coordinates of these positions, the EAR and MAR were calculated. The EAR gives context for blinking, shown as a rapid decrease approaching zero, as well as reduced eye aspect ratio characteristic of “drowsy” eyes.

After calculating the ratio features from the coordinate positions, the features and ratios are normalized within the time series. Next, these features were reshaped to a three-dimensional input as 2-second batches of information.
The extracted feature positions and ratios were then inputted into a two-layer LSTM network with 0.2 dropout layer and softmax activation. The model was trained for 100 epochs using Keras and Tensorflow with Adam optimizer and a learning rate of 0.001 to optimize the network weights. The output was given as the probability of drowsy or alert.

Model B: CNN-LSTM
The second approach serves to extend this idea further and allow a model to learn to only sequence of extracted features, but a temporal sequence of images. The first step in this model is to extract the faces from each frame. This was done using Viola-Jones Haar -Feature based Cascade Classifier. To avoid false positives, we first detect the Region of Interest (ROI) around the face and apply face detection to obtain a rectangular localized patch containing the whole face. From the video stream, a frame is extracted for processing and CAMshift is used to track the ROI in the following frames. Histogram Oriented Gradient (HOG) algorithm is then applied to the first frame to extract dense features from the image. This algorithm can extract all features from a region of interest (ROI). The candidate face from among the detected faces is then decided as being the one that has the largest area assuming that the driver is nearest to the camera. Only this face region is then processed in subsequent video frames, reducing the processing cost. Each video is converted into a folder of cropped facial images in the sequence of time.
To extract significant visual features from the images, we use a Convolutional Neural Network (CNN). We used the pre-trained model, Inception v3, which is trained on the Image-Net Data set comprising of 1000 classes. Using transfer learning, we retain the final layer of this model on our data set with TensorFlow. The model reported an accuracy of 98.8% on the validation set. Each frame of every video is then run through the Inception model, and the output from the final pooling layer is saved. This results in a 2048-Dimensional vector of features, which is passed to the sequential neural models. Finally, we convert these extracted features into sequences of extracted features.
To train the sequential model, the stitched features in the training data set consists of 160 batches x 50 frames per batch x 2048 feature vectors. We used a 2048 wide LSTM layer, followed by a 1024 dense layer with dropout. We trained the model for 10 epochs using Keras and Tensorflow with Adam Optimizer and a learning rate of 5e-5 to train and optimize the network weights.


Results
Evaluation Metric
To evaluate our two approaches, the AUC (area under the receiver operating characteristic curves (ROC)) scores were computed to determine the performance of the classification models. The ROC curve plots two parameters: true positive rate (TPR) and false positive rate (FPR). AUC provides an aggregate measure of performance across classification thresholds.

Experimental Results
The results of the comparison of these two variations are shown in Table 1. This shows that the two models both confidently classify the alert and drowsy cases with a low probability of misclassification. The CNN model does outperform the FFE model.


Demo
Conclusions
Both proposed models were able to predict drowsy and alert participants with high confidence. As expected, Model B (CNN+LSTM) outperformed Model A (Facial Feature Engineering). However, the major trade-off between the first and second model was the time and computational cost for training. The training time for Model A was approximately a minute per video, whereas the training for Model B took approximately three hours per video. As this research aims to detect early and subtle signs of drowsiness in order to prevent accidents due to fatigue, it is worthwhile to spend time and computation to train a highly accurate model.
It is interesting to note that for the models that we propose, the training accuracy can also be very meaningful. Currently the models are trained on a finite number of participants, thus a limited spread of diversity, and then validated using the video of a participant that the model hasn’t seen before. However, we can take this work further and create a prototype where we have an initially untrained model and then install it in a car. Now, as the driver who owns the car starts making trips, he or she can record each of their trips and then mark the times they felt drowsy or alert. This means the model trains and over-fits to their particular face, and the testing accuracy becomes as good as the training accuracy. This means that we could potentially achieve 99.99% accuracy and reduce road accidents due to drowsiness to almost zilch.
References
- Klauer SG, Dingus TA, Neale VL, Sudweeks JD, Ramsey DJ. The Impact of Driver Inattention on Near-Crash/Crash Risk: An Analysis Using the 100-Car Naturalistic Study Data, 2006.external icon Springfield, VA: DOT; year. DOT HS 810 594.
- Tefft BC, AAA Foundation for Traffic Safety. Prevalence of Motor Vehicle Crashes Involving Drowsy Drivers, United States, 2009–2013 [457 KB]external icon.Washington, DC: AAA Foundation for Traffic Safety; 2014. October 19, 2015.
- A Realistic Dataset and Baseline Temporal Model for Early Drowsiness Detection by UTA
- Co-Occurrence Feature Learning for Skeleton Based Action Recognition Using Regularized Deep LSTM Networks Proceedings of the Thirtieth AAAI Conference on Artificial Intelligence (AAAI-16)
- Drowsy Driver Detection by Nisha Gandhi
- Eye Blink Detection Using Facial Landmarks by Tereza Soukupov ́a
- https://www.youtube.com/watch?v=3uMlNuXfNfc&feature=youtu.be
