Jiayi TanFinal Class IndicatorInspired by Kathy’s post, I decided to write a Medium article on how to evaluate myself in this class. I would say my benchmarks of…Apr 17, 2019Apr 17, 2019
Jiayi TanA First Encounter With LuckWhen I was asked to quantify luck for a data visualization assignment, I was honestly stumped. Luck? Wasn’t that spontaneous…Mar 29, 2019Mar 29, 2019
Jiayi TanThe Power of a Community — Fending Off Questions from a Fast Fashion ExpertLast week, I had uploaded my data visualizations on the polluting effects of fast fashion. I hadn’t thought much of what I could do to…Mar 19, 2019Mar 19, 2019
Jiayi TanFast Fashion Is a Bigger Pollutant Than You ThinkThe great bogeymen of environmental pollution — oil, agriculture, livestock and…fashioMar 15, 2019Mar 15, 2019
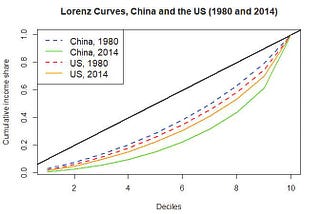
Jiayi Tan1980 vs 2014: How Unequal Are The US and China?This graph shows the historical Lorenz curves for China and the US in 1980 and 2014. The Lorenz curve is often used to measure inequality…Mar 12, 2019Mar 12, 2019
Jiayi TanTerm Usage as A Meaningful Indicator of Societal Favour with MeritocracySo people have been talking more and more about meritocracy since the 1950s, what does it mean for society?Mar 5, 2019Mar 5, 2019
Jiayi TanWhat’s The Deal With Iodized Salt?Iodized salt seemed like a weirdly specific topic for the larger theme of food. Who, after all, even noticed if their salt was iodized or…Feb 18, 2019Feb 18, 2019
Jiayi TanA Reflection on a “Data Class” — DMIWhen I took the class, Developing Meaningful Indicators, I saw it as a social science class that taught the quantification of concepts…Feb 13, 2019Feb 13, 2019
Jiayi TanGun Violence and Happiness in 50 StatesChoosing the topic of gun violence was a difficult choice for me. It was trite, both in the world of qualitative journalism which I was…Jan 31, 2019Jan 31, 2019