PinnedJon Olav H. EikenesinNightingaleDesigning a custom data visualisationHow I solved the 14th Data For A Cause challenge — and won!Apr 24, 2019Apr 24, 2019
Jon Olav H. EikenesinOcean Industries Concept LabHow to create your own HoloLens sun screenGet the template for a sunscreen that provides clear HoloLens graphics even in sunny conditions.Jun 17, 2019Jun 17, 2019
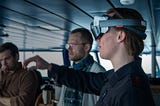
Jon Olav H. EikenesinOcean Industries Concept LabWhat does an ice breaker do?We spent four days onboard an ice breaker. Here are some of the scenarios we observed, and challenges that demonstrate the need for designAug 8, 2018Aug 8, 2018
Jon Olav H. EikenesinOcean Industries Concept Lab(Re)categorising Augmented RealityWe are about to reach a state where Augmented Reality (AR) becomes both useful and usable. The following is an attempt at (re)categorising…Aug 1, 2018Aug 1, 2018
Jon Olav H. EikenesinBransjebloggen 3minTeknikkar for Auka Røynd (AR)Nokon kallar det auka røynd, andre kallar det augmented reality (AR).Aug 1, 2018Aug 1, 2018
Jon Olav H. EikenesUsers, visits or page views: Why the unit of analysis matters for your news siteHow you measure success matters. The goals and key metrics you define will enable your team to know if you are on track or need to change…Dec 17, 20172Dec 17, 20172
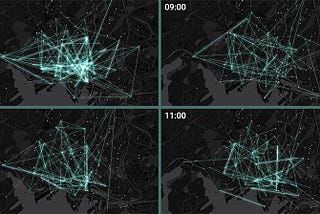
Jon Olav H. EikenesExploring open data from Oslo City BikeA city full of blue and white bikes is a sure sign that spring has arrived. Carefree hipsters as well as parents running late for work are…Apr 23, 20173Apr 23, 20173
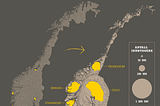
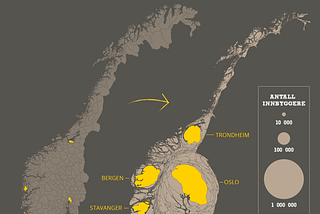
Jon Olav H. EikenesLei av Norgeskartet? Leik deg med kartogram og data frå SSB!Kartogram er ei ganske sær form for visualisering, som går ut på å skalere ulike geografiske område på eit kart basert på data. Kva skjer…Sep 7, 20151Sep 7, 20151