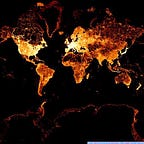
Using satellite imagery to solve probe data problems.
Yesterday, Telenav and INRIX announced a partnership to combine their datasets and software to improve OpenStreetMap (OSM):
“This collaborative effort will drive significant and accelerated updates to OSM by aggregating and analyzing large amounts of GPS probe data from vehicles and devices around the world to enhance traditional mapping methods.”
For me, this is a fantastic match, with an outcome that benefits everyone. Yes, I said everyone. OpenStreetMap is a widely adopted, open source inventory of everything on our planet. You may or may not realize it, but you’ve likely benefited from OSM through the apps you use, the places you’ve been or how you’ve got there (walk, bike, car, plane or train).
Probe data from cars and smart phones is taking OpenStreetMap to the next level. Mapbox has been doing this (really well) for a while now and has a cool explanation of how this works: https://www.mapbox.com/telemetry/.
One of the world’s most experienced mappers and all around amazing person Martijn van Exel posted this note this morning:
“Hi all, Telenav partnered with INRIX to add more than 800,000 more missing road tiles to ImproveOSM worldwide. If you haven’t tried ImproveOSM, it’s a tool that points out potential missing roads, one-way streets and turn restrictions based on the analysis of billions of GPS points. Give it a(nother) try and let me know what you think.
http://improveosm.org/#background=Bing&map=7.25/30.138/78.539
Best, Martijn”
What’s really cool about this is they’ve created a tool called ImproveOSM that allows anyone to look at areas where probe data doesn’t match OSM. You can then make the change and improve the map right in the interface as long as you are a registered OSM contributor (free and easy). In other words, this is a cool way to solve mapping problems through crowdsourcing.
Let’s take a look: I went to Denver first since that’s where I live:
This interface is very intuitive - I didn’t need to read instructions to understand what’s going on and how to use this. Here is a map of Denver and according to the legend, the red dots indicate possible missing roads and the blue dots indicate possible issues with turn restrictions. All of these are “open” issues meaning they need attention. I went to the largest red dot, to the East of Denver in a suburb named Aurora.
This is immediately interesting to me. I see an open area, with something on the ground that looks like an old race track or something. I can see that it’s overgrown (weeds, bushes etc.). But according to the probe data from INRIX and Telenav, something is traveling across this area. The purple squares indicate possible missing roads, and the yellow squares indicate possible parking. Turning those layers off gives me a better look at the Bing Maps imagery:
This looks like an old airport or racetrack so I did a Google search for old raceways in Aurora. Found it: this used to be the “Century 21 Raceway”. I found this amazing photograph below from an old blog post. (I always try to credit the originator of photos, but in this case, I had a hard time finding the source and the license, so I hope the below credit suffices.)
There is a YouTube video of someone driving across it and you can sell all the overgrowth. In the description it says this closed in 1974. Maybe the YT videographer is the source of the probe data??? In order to solve this, I brought in some very recent imagery from DigitalGlobe. DigitalGlobe collects high resolution and highly accurate imagery all over the world using the most advanced commercial satellites. This data is processed and made available through web services and APIs. It is literally a single URL I can add to the ImproveOSM editor to get going (as long as I have an existing subscription to the DigitalGlobe service.)
Ok, this image shows me something is changing. It looks like the old raceway is being developed into either a housing development or a business park. I can see construction equipment which explains the suspected parking and a newly paved road which explains the missing road. I can also see excavating being done. Now when I turn on the probe data, I can see alignment with the newly paved roads, and even alignment with the construction roads. So that probe data INRIX and Telenav has is from construction equipment, vehicles and devices used by excavators and contractors.
So now I can resolve this problem by adding the new roads. By clicking each square, I can resolve each issue and I added a comment that I added a road. I was also able to add the names of the roads using open data from the City of Aurora.
In summary: 1) Probe data is really helpful for mapping 2) Relevant and accurate satellite imagery helps us solve problems and “answer” questions derived from probe data 3) OpenStreetMap is improved and the benefits of this cascade across apps, maps and platforms. 4) I learned something new today about local history and lastly 5) the food trucks can now drive down E 19th Ave in Aurora Colorado to make sure the construction workers have a delicious lunch. (and yes, the catering industry are power users of DigitalGlobe imagery and OSM mapping data!!)
If you or your organization want to get access to recent imagery to solve cool problems, hit me up or check out https://developer.digitalglobe.com/
