Ashish TomarBuilding An Interactive RNAseq Data Visualization App using ShinyRNA-Seq (named as an abbreviation of RNA sequencing) is a sequencing technique which uses next-generation sequencing (NGS) to reveal the…May 8, 2023May 8, 2023
Ashish TomarCreating a genomics Data Lake By Using AWS S3, Glue, and AthenaGenomics data analysis produces huge amount of data and this trend data is increasing with advancement in technology and genome sequencing…Apr 22, 2023Apr 22, 2023
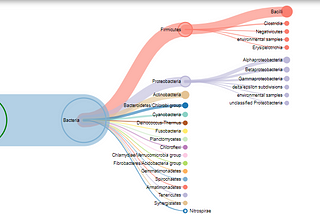
Ashish TomarMetagenomics Data Visualization: Visualizing high dimension data using D3.jsThe microbial community plays an important role in human health by playing a significant role in maintaining host health, which supplies…Aug 1, 2022Aug 1, 2022
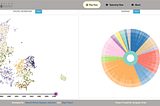
Ashish TomarBuilding An Interactive Microbiome Data Visualization App using Shiny FluentMicrobiome analysis outputs hierarchical data having a different level of taxon and their abundance in samples. Microbiome data…Aug 1, 20221Aug 1, 20221
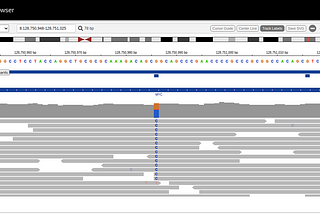
Ashish TomarCreating an IGV genome browser using igv.js and Reactigv.js is an embeddable interactive genome visualization component developed by the Integrative Genomics Viewer (IGV) team. The aim is to…Dec 26, 2021Dec 26, 2021
Ashish TomarDesigning Data Visualization UI For Danish Beetle AtlasEnabling biodiversity data visualization with D3.jsOct 18, 2021Oct 18, 2021
Ashish TomarWeb Scraping Genomics Data using Beautiful soupWeb scraping or web data extraction is data scraping used for extracting data from websites.Oct 8, 2021Oct 8, 2021
Ashish TomarBuilding ETL data Pipeline for genomics using Apache AirflowIn Genomics data pipelines are used heavily to move data from one/multiple resources for transformation, aggregation and storage. The…Oct 7, 2021Oct 7, 2021
Ashish Tomar2019 GBIF Ebbe Nielsen Challenge — Bio-geocoding: Automated Geocoding Of Biodiversity DataWhat is GBIF?May 4, 2019May 4, 2019
Ashish TomarVisualizing Biodiversity Data With D3.js And leaflet.jsData visualization has emerged as an interesting field for exploring data using interactive features as charts, graphs, and networks for…Oct 10, 2018Oct 10, 2018