maeveFinal charts<div class=”flourish-embed flourish-cards” data-src=”visualisation/8092569"><script…Dec 10, 2021Dec 10, 2021
maeveHomework 9: TakeawaysAs I have been reviewing my data from StreetEasy, my manually collected data from Google Maps, and my surveyed data, I have found some…Nov 12, 2021Nov 12, 2021
maeveHomework 8: “All the Chart Types”“Price Per Square Foot” (Definitely a working title.)Nov 5, 2021Nov 5, 2021
maeveFiltering food data- CaviarFor this homework assignment, I chose to pick out and sort foods with caviar in the name from the NYPL menu data.Oct 15, 2021Oct 15, 2021
maeveHomework 5: Pivot tables, Bigfoot dataWorking with pivot tables: Bigfoot DataOct 5, 2021Oct 5, 2021
maeveHomework 4: Midterm TopicsFor my midterm, I have decided to study one of these two topics:Oct 1, 2021Oct 1, 2021
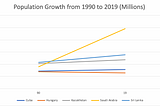
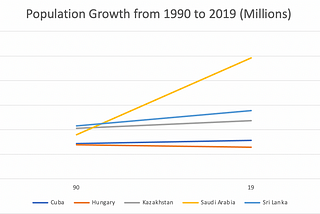
maeveHomework 3: Slope charts, manipulating dataFor my slope chart, I chose to use data from the UN Human Development Index that measured the size of the population in each participating…Sep 22, 2021Sep 22, 2021
maeveData Visualization: HW 2Journalism Handbook: I liked the three points at the beginning of the article, especially “Data requests should begin with a list of…Sep 16, 2021Sep 16, 2021
maeveMy Play Collection- Data VisualizationMy play collection, visualized in “Dear Data” style.Sep 9, 2021Sep 9, 2021