Continuous Change Detection plugin for QGIS
Interest in satellite time series modeling and segmentation has been steadily increasing. One of the most effective methods for this task is the Continuous Change Detection (CCD) algorithm. In this post, we introduce the QGIS CCD Plugin, a tool that aims to facilitate the visualization of CCD’s results.
Quick introduction to CCD
The Continuous Change Detection algorithm was introduced by Zhu & Woodcock (2014) with the aim to model time series of satellite data. The algorithm adjusts a harmonic regression to the time series, allowing to decompose it into trend, seasonality and breaks. A break in the time series is identified if the deviation from observations and model predicted values surpasses a given statistical limit. These capabilities have prompted the use of the method for a variety of applications in the remote sensing community, especially for monitoring disturbances in the vegetation.
The CCD Plugin for QGIS
Although in most cases we are interested in numerical results, visualizing CCD’s regression adjustment and breaks in a chart helps understand what the model is actually doing and how well its job is being done. Additionally, having a tool integrated into a GIS environment that quickly and flexibly provides a glimpse of what the adjustment looks like at various locations can come in handy. With that in mind, the QGIS CCD Plugin was introduced.
I. Plugin installation
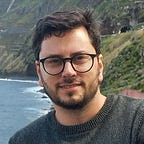
The plugin can be easily installed directly from the QGIS Plugins Repository. On QGIS, look for “Manage and install plugins” under the “Plugins” tab. Then, search for CCD-Plugin (icon shown below). Once installed, the plugin will be automatically added to your toolbar.

II. Earth Engine authentication
The CCD-Plugin uses Google Earth Engine to retrieve satellite image time series and run the CCD algorithm. Therefore, it needs to have the Earth Engine (ee) python library installed on QGIS. If you don’t have it yet, the plugin will do that for you. Additionally, you’ll have to have Earth Engine authenticated on QGIS. If you have already used ee on QGIS before, you’re good to go. Otherwise, a message box should pop up with a link for you to log in with your Google account and proceed with the authentication.
III. Utilization
By clicking on the plugin icon in the QGIS toolbar, the plugin will open in a docked window at the bottom of the QGIS main window. From there, you can configure the plugin’s settings, execute it and visualize the results.

Here is a step-by-step guide of how to use the CCD-Plugin:
- Click on the “Pick on Map” button and select a location of interest on the map;
- Select the satellite dataset to be used. Currently, the plugin supports Landsat and Sentinel-2 data;
- Select the Band or Index to be plotted;
- Select the bands and/or indices used for change detection;
- Select the date range of the time series — start and end dates;
- Select the Days of Year range in case you want to work with images from specific days (if you want to use all images of a year, leave the default values);
- (Optional) Change CCD’s parameters (lambda, chi-square, minYears and numObs) by clicking on the “Advanced settings” button;
- Generate chart.
After hitting “Generate”, it might take a few seconds until the data are processed and the chart is displayed. However, after the first execution, you can simply change the Band/Index to be plotted and the plugin will quickly render a new chart, since the data were already processed and retrieved. Keep in mind that if you change any of the other inputs, you’ll need to hit “Generate” again.
IV. Visualize results
The results are displayed in the plugin main window, exhibiting the model adjustment in terms of temporal segments (green and purple curves in the image below) and break dates (dashed red line).

We hope this tool can be useful for the community and empower those interested in land cover monitoring with satellite imagery!
You can check the code, report any bugs and make suggestions in the plugin repository on GitHub.
CCD-Plugin was developed by Xavier C. Llano and co-developed by Daniel Moraes.