Understanding a business with Causal — Phil Libin’s state machine
I needed something to do while being quarantined. So I decided to play with a tool I have been fascinated with since its launch on Hackernews, Causal. Causal lets people build models with uncertainty attached to the variables. Its an intuitive way to understand models and their assumptions.
tl;dr : I recreated Phil Libin’s State Machine in Causal.
Here’s the model: Causal
A state machine is a model of a system. Each node is a “state” and each connecting line (edge) is an input that changed this system to its next state. Here is a simple state machine for a coin operated turnstile.

Phil Libin’s State Machine -
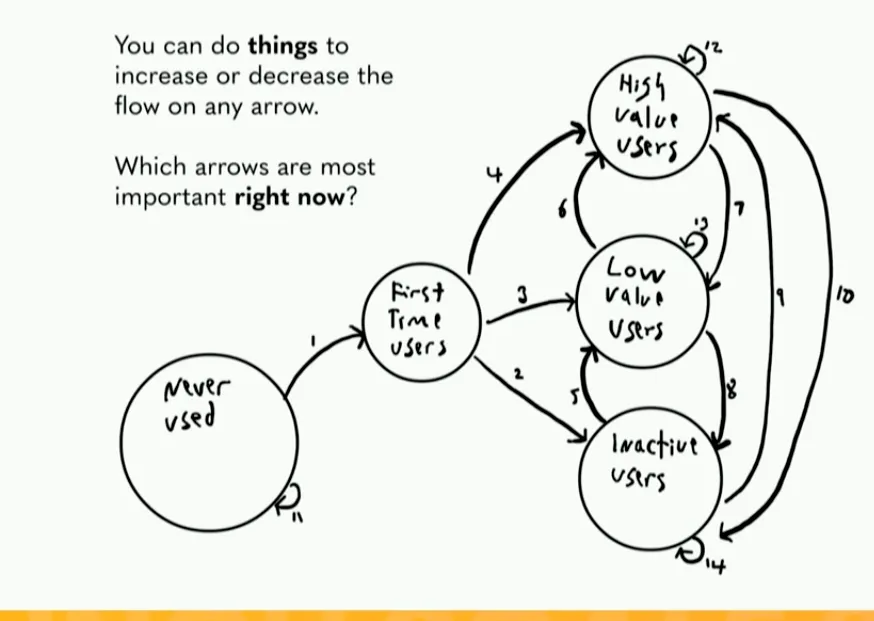
What is being modeled here is how people behave within a business life cycle. People start out unaware of the business, get onboarded for the first time, then either are not interested(Inactive) or become a customer for different pricing plans.
The point is that with access to ratios for each edge in this graph, a business can understand which metric to prioritize for its stage. For example edge 6, from “Low Value Users” to “High Value Users” is an upsell metric( usually measured as MRR Growth)
Building the model in Causal -
What I did first was convert that state machine to the following table

Now came the tricky part, I had to decide if I should have ratios for each state change or let people enter in raw numbers for each state and calculate the ratios for reporting and bench-marking. The former seemed a better approach and so I did that.
Here is what that looks like

Now I wanted to start out with a simple MRR output. So I added a chart for the output. Here is what that looks like

This was very easy to do in Causal and a thoroughly enjoyable exercise. Here is what I plan to do next
- Build a model with data coming in via integrations.
- Extend the model to calculate ratios, given number of users in each stage
- Extend the model to have a time series output for all the important SaaS metrics.
Take-Aways:
- State Machines make for complicated models, so don’t start with a state machine.
- Thinking about what metric to keep variable and what to track was the biggest issue. Got around to actually developing the Causal model in less than 30 minutes.
- Causal has an easy learning curve and is very flexible
I have made the model clone-able( like Webflow templates ) so you can extend it as well. Happy modelling.
