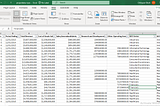
Okoh ChibuzorVISUALIZATION OF A SUPERSTORE SALES DATA USING POWER BIINTRODUCTIONAug 8, 20222Aug 8, 20222
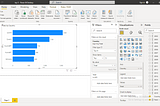
Okoh ChibuzorHOW TO CREATE A “TOP 5” VISUAL USING POWER BIThe data used for this was a suicide data for all countries from 2000–2019 gotten from Kaggle. Using Power BI, I will show you how to get…Aug 4, 2022Aug 4, 2022
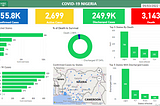
Okoh ChibuzorNCDC DASHBOARD USING POWER BIRecently, I worked on the National Center for Disease Control (NCDC) data and built a dashboard using power BI. The data used for this…Aug 1, 2022Aug 1, 2022
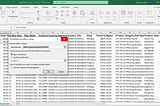
Okoh ChibuzorDATA VISUALIZATION AND ANALYSIS USING THE SALES DATA OF A SUPERMARKET.I worked on a Sales data gotten from Kaggle for a supermarket with branches in four cities (Boston, Los Angles, New York and San Diego)…May 17, 2022May 17, 2022