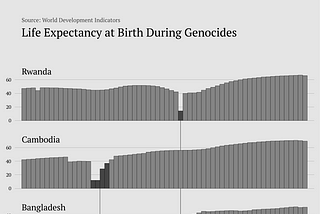
Oscar LeoinLevel Up CodingMatplotlib Tutorial: Life Expectancy at Birth During GenocideI will teach you to create the chart below 👇·4 min read·Apr 28, 2024----
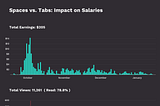
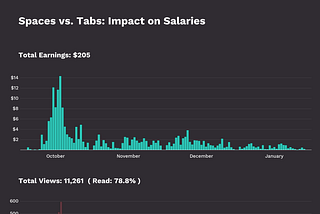
Oscar LeoinLevel Up CodingHow I Create Data Visualizations of My Medium Stories With MatplotlibI will teach you how to create the chart below👇·7 min read·Apr 28, 2024----
Oscar LeoinDataDrivenInvestorThis Previously Poor Country is Now The World’s Fastest-Growing EconomyHow a struggling economy increased its GDP by over 180% in three years·3 min read·Apr 5, 2024--1--1
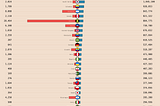
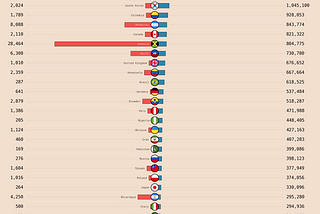
Oscar LeoinDataDrivenInvestorThe 50 Most Common Nationalities for Immigrants in the United StatesI ❤️ creating beautiful data visualizations and started a free newsletter called DataCanvas Daily, where I publish a new design daily.·2 min read·Mar 31, 2024----
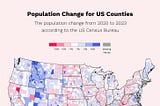
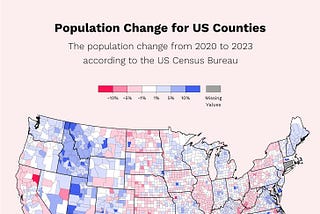
Oscar LeoinDataDrivenInvestorTwo Beautiful Data Visualizations on Population Change in US States and CountiesI enjoy creating beautiful data visualizations using all forms of fascinating datasets. In this story, I will show you two of my latest…·2 min read·Mar 26, 2024--2--2
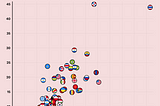
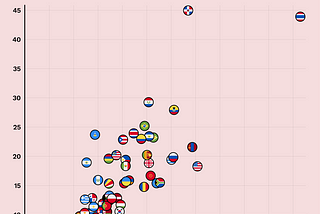
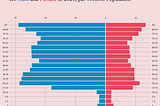
Oscar LeoinDataDrivenInvestorDaily Chart: Fatal Traffic Accidents WorldwideVisualizing fatal traffic accidents between genders in multiple countries·2 min read·Mar 19, 2024--1--1
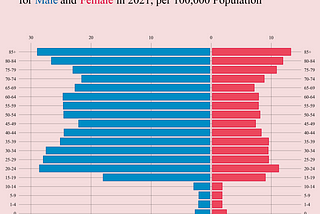
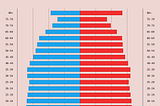
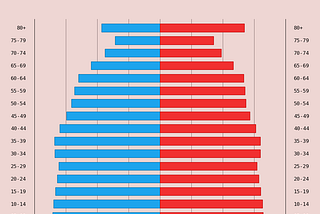
Oscar LeoDaily Chart: The Victims of Fatal Traffic AccidentsVisualizing gender and age for fatal traffic accidents in the United States·1 min read·Mar 18, 2024----
Oscar LeoDaily Chart: Animating the World’s Population GrowthUsing population data and estimates from the World Bank to visualize the change in demography over time·1 min read·Mar 17, 2024----
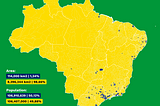
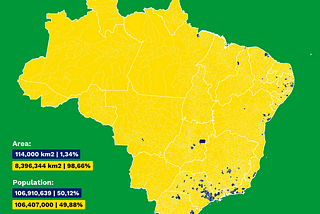
Oscar LeoDaily Chart: Splitting the Population of Brazil in HalfPlotting the smallest area of Brazil containing more than 50% of the population·2 min read·Mar 16, 2024----
Oscar LeoDaily Chart: Ranking and Grouping US Counties on PopulationI enjoy creating beautiful and insightful data visualizations and started a free newsletter, DataCanvas Daily, where I plan to publish a…·2 min read·Mar 15, 2024--1--1