Using leaflet to study wine regions
One of the components to learning about the world of wine is geography. Where are wine grapes grown? Why are they grown there? What is the climate like in those locations? If you want to go further down the rabbit hole, you can study all the country specific legalese for each individual region, like minimum must weight and vine spacing. France alone has some 300 wine appellations scattered across the country each with different geographic and legal characteristics. In the past, studying these appellations meant finding maps and printing them out. Map quality ranges from simple and useful to downright artistic:


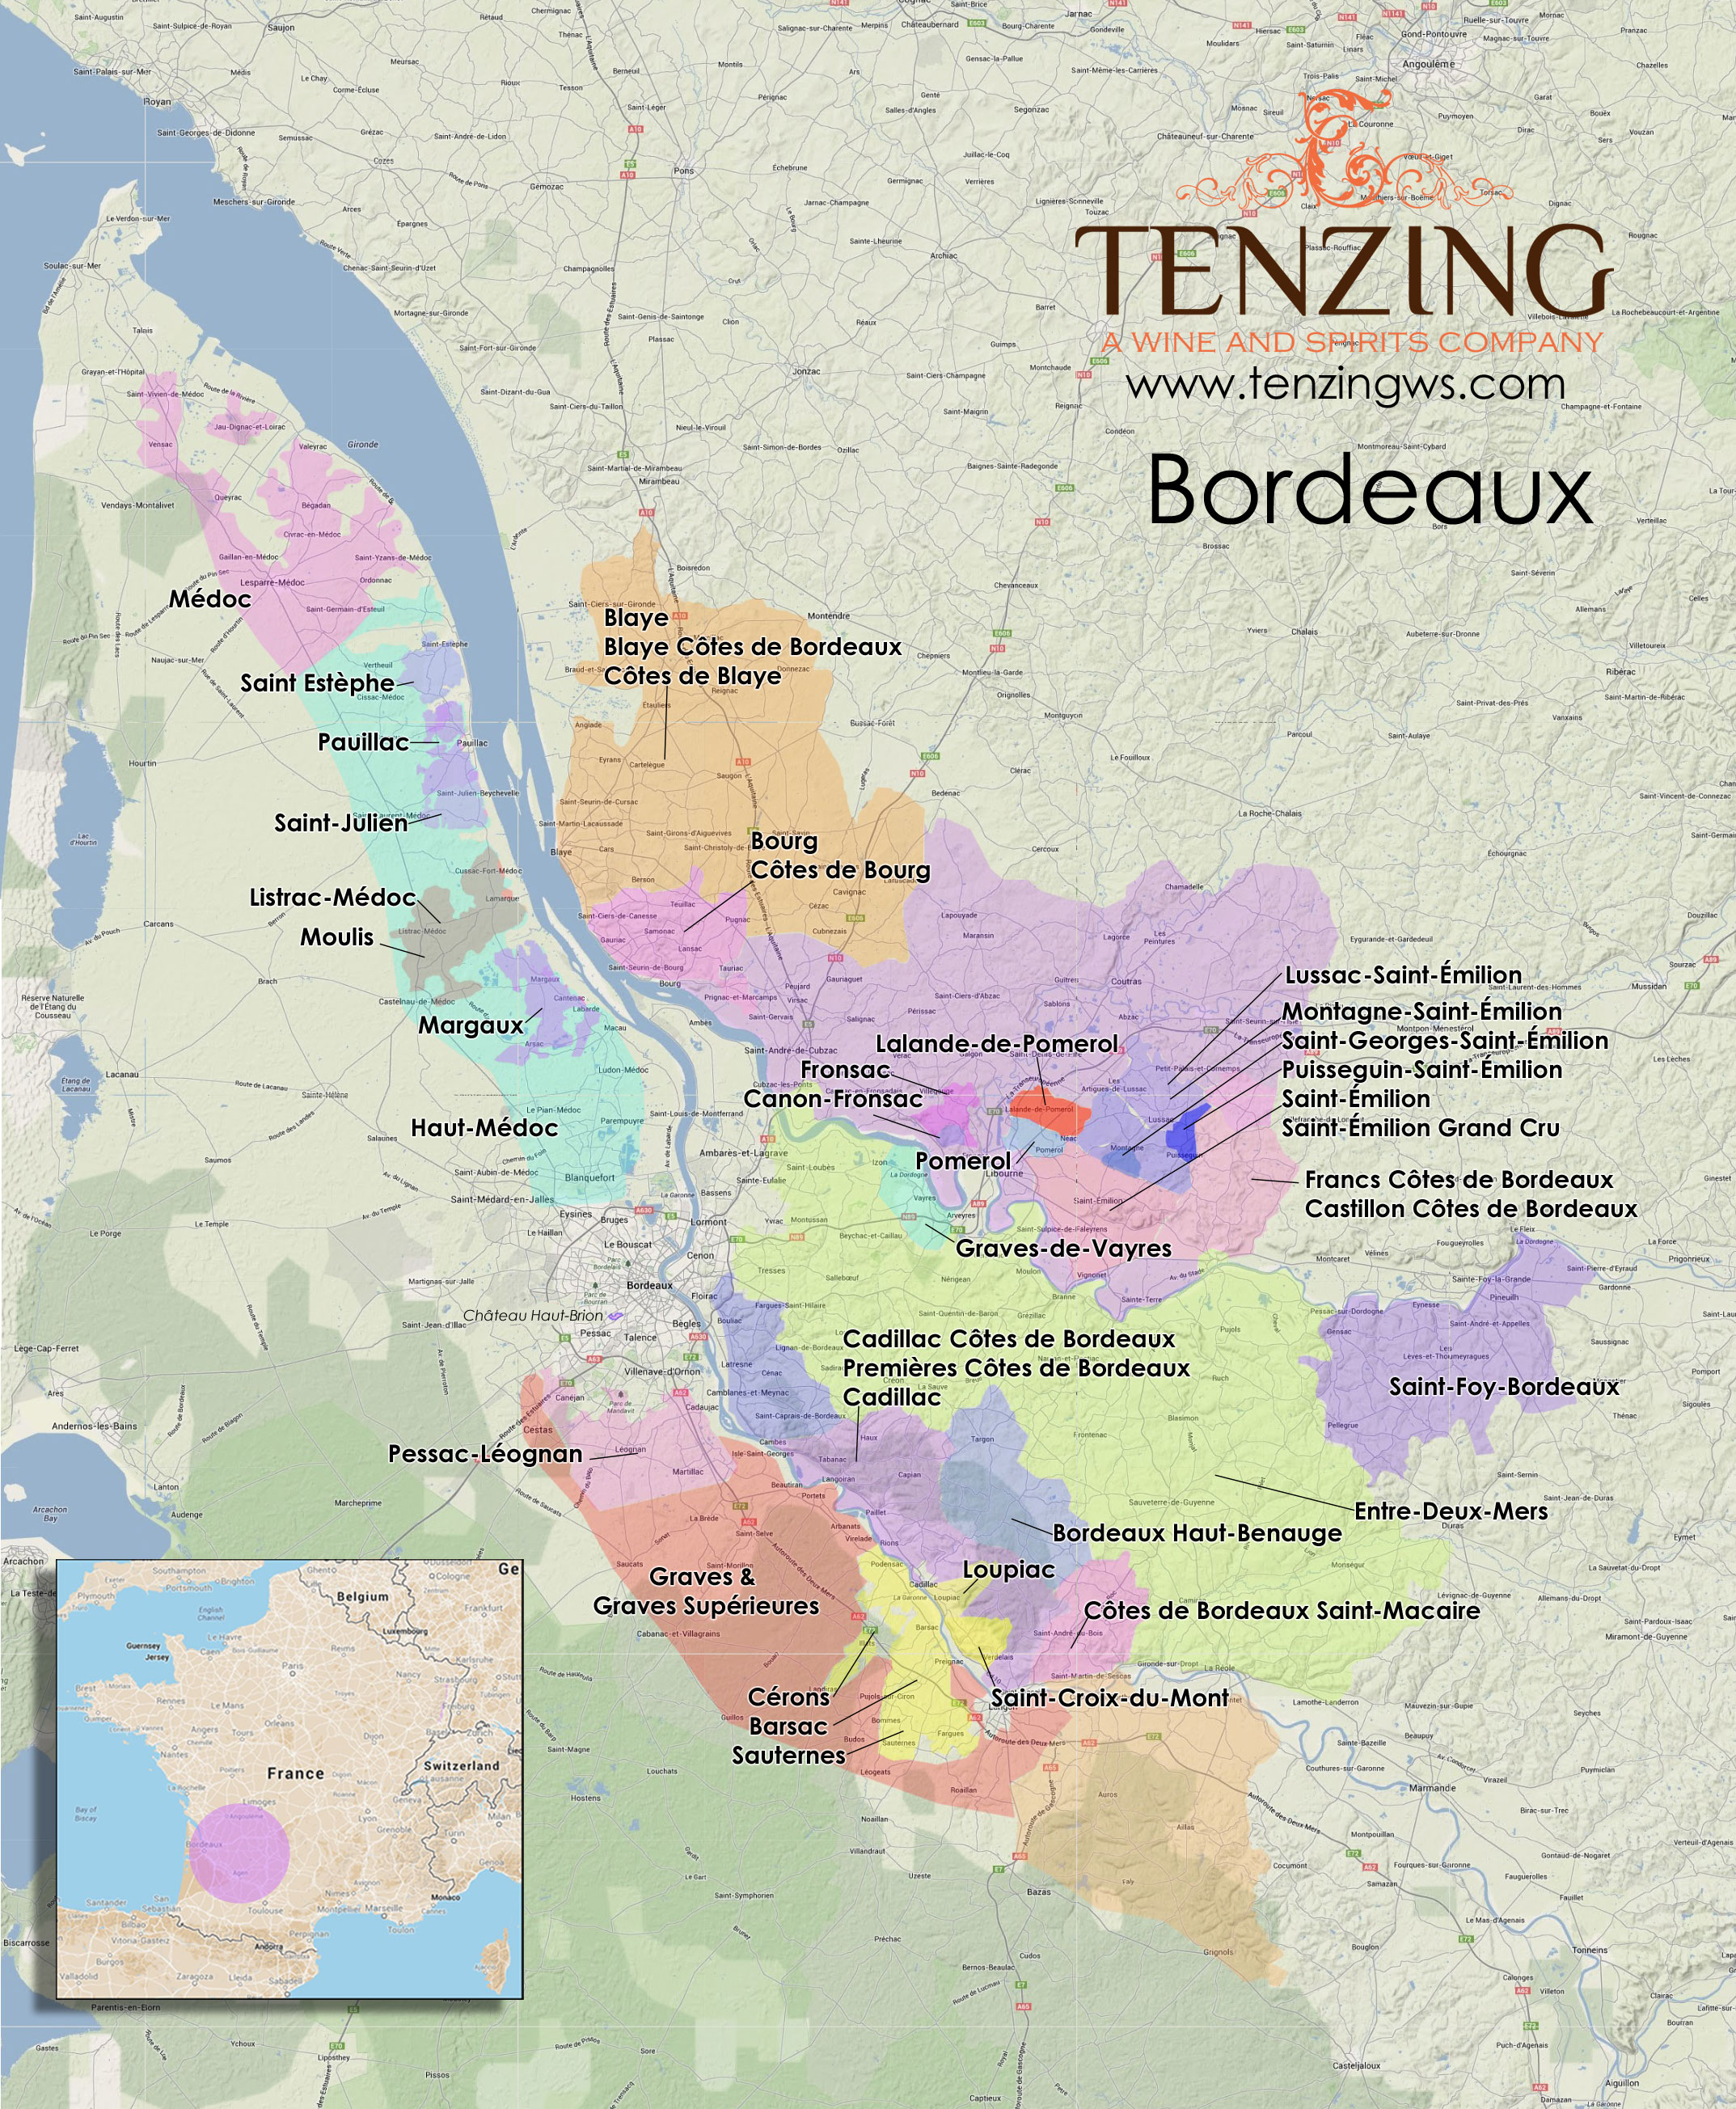
But none of these maps are interactive. What you see is what you get. What if I wanted to zoom in and look at satellite imagery of these regions? This shouldn’t be too difficult, simply find a data representation of the appellations and plot them on an interactive map. It turns out this is easier said than done.
First, finding a data representation of wine appellations is difficult. I still have yet to find a good source, for any country, of wine appellations in shapefile or geojson format. So I decided to build my own. While this would be a lot of work, it would also force me to learn even more. All I would need to do is find the legal definition of the individual appellation areas (AOCs) from the French INAO (Institut national de l’origine et de la qualité) and Google will help.
Searching for something like “Medoc AOC INAO definition” returns a lot of wikipedia pages, but nothing from the INAO. After spending a couple of hours doing searches, I realized a flaw in my plan; English, or perhaps more appropriate, French. The INAO website and it’s Google search keys are all in French. So my “Medoc AOC INAO definition” search needed to be “Medoc AOC INAO fiche Aire géographique”. Lo and behold, I found my way to these:

After finding the INAO maps, I was able to build geojsons by using the INAO graphics with QGIS and some French Commune shapefiles. You can find them here.
The last part was tying all the appellations into an interactive map, and that’s where leaflet comes in. Leaflet is really intuitive and as a bonus, works with Amazon AWS S3 static website hosting. Within in a couple of days, I was able to throw together an interactive map that acts as a Bordeaux AOC Quiz and host it at AWS with near 0 cost.

Check it out and let me know what you think: