Rajan DavisAnimating plots using matplotlib and ffmpegData visualizations are important for telling stories. They should reveal insights into our data that may not seem evident from a cursory…Oct 24, 2018Oct 24, 2018
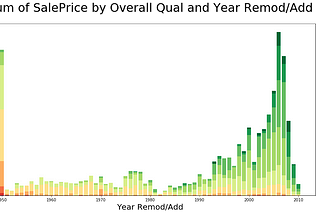
Rajan DavisStacked Bar Charts: what are they and how to make themStacked bar charts can be a great way to visualize data that has both a hierarchical/categorical component that evolves over time…Oct 24, 2018Oct 24, 2018
Rajan DavisIntro to pandas: Part IIContinuing on from my last post, I want to cover a few more pandas methods that I have found helpful in parsing though datasets.Oct 23, 2018Oct 23, 2018
Rajan DavisIntro to pandaspandas is an open source python library to make data more manageable. It is a crucial component for most data scientist’s workflows and is…Oct 23, 2018Oct 23, 2018