Sabhaya harshPractical ExaminationTask-1: Dataset Description using Orange tool.Nov 16, 2021Nov 16, 2021
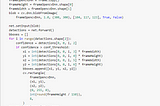
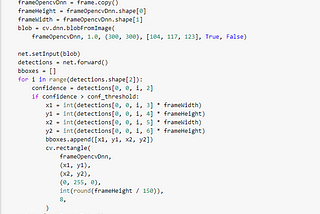
Sabhaya harshUsing image data, predict the gender and age range of an individual in Python.IntroductionOct 28, 2021Oct 28, 2021
Sabhaya harshData Science: Build Your First Power BI ReportWhat are Dashboards?Oct 28, 2021Oct 28, 2021
Sabhaya harshHow to build a simple dashboard using Power BIName: Telecom Churn DatasetOct 28, 2021Oct 28, 2021
Sabhaya harshNeo4j graph database and Gephi tool.This blog is about how to use two different tools like Neo4j and Gephi for data visualization in graphical form.Oct 28, 2021Oct 28, 2021
Sabhaya harshIntroduction to PowerBI and Get started with PowerBIPower BI is a Data Visualization and Business Intelligence tool that converts data from different data sources to interactive dashboards…Oct 28, 2021Oct 28, 2021
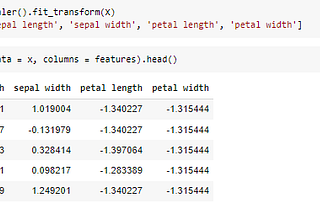
Sabhaya harshData Pre-processing tasks using python with Data reduction techniquesData Reduction: Since data mining is a technique that is used to handle huge amount of data. While working with huge volume of data…Oct 28, 2021Oct 28, 2021
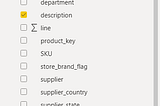
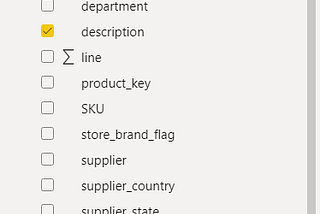
Sabhaya harshData Preprocessing with Orange ToolPreprocessing is a key component in Data Science. The orange tool has various ways to achieve the activities.Oct 7, 2021Oct 7, 2021
Sabhaya harshIntroduction to Orange Tool Part-2This blog is all about how to split data into training and testing using the Orange tool. We will also learn more about Test & Score…Oct 7, 2021Oct 7, 2021