Sajjad AhmadiVisualizing Change with Arrow Charts in Power BIA Step-by-Step Guide to Creating Arrow Charts in Power BI for Visualizing Changes and Enhancing Data Analysis7 min read·Mar 29, 2024--1--1
Sajjad AhmadiDynamic Selection and Highlighting: A Guide to Unlocking the Power of Stacked Bar ChartsStep-by-Step Guide to Dynamic Selection and Highlighting in Stacked Bar Charts with Power BI7 min read·Mar 16, 2024--2--2
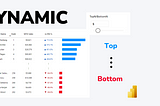
Sajjad AhmadiinMicrosoft Power BIDynamic Comparison: Visualizing Top and Bottom Performers in One VisualUnlock the Power of Seamless Comparison between Top and Bottom Performers with this Step-by-Step Guide6 min read·Mar 5, 2024--3--3
Sajjad AhmadiinMicrosoft Power BI5 KPI Card Examples Created With HTML in Power BIAs dashboard designers, we know that KPI cards play a crucial role in the structure of dashboards, such that even sometimes, a whole…6 min read·Mar 4, 2023----
Sajjad AhmadiinBetter ProgrammingVisualizing the Third Numeric Variable in PythonExploring different approaches to visualize a third numeric variable using Matplotlib and Seaborn9 min read·Feb 6, 2023--2--2
Sajjad AhmadiinBootcampCombining Charts or Numbers with Context-Related ShapesIt is a proper choice to use charts for navigating and answering questions about our dataset. But when we want to go to the next level and…3 min read·Dec 26, 2022--1--1