Basics of Linear Regression
All basic things you need to know about Linear Regression.
What is Regression?
Basically regression means a measure of the relation between one variable(e.g. output) and corresponding values for other variables(e.g. Input like cost and time).
As mentioned above, for regression tasks the goal is to predict a continuous number, or a floating point number in programming terms(or real number in mathematical terms).
Example 1:- Predicting energy consumption by appliances in a home by using temperature of that home/room, humidity of that room, how much time an appliance is running a day, which weather season is there.
Example 2:- Stock price prediction using attributes like previous price range history, time of the day, economical factors impacting on it.
How can we get to know whether it is a regression or classification problem?
An easy way to know whether the given problem is of regression or classification is to take a look at the output variable. If there is continuity between possible outcomes, then the problem is a regression problem.
Linear Regression (Ordinary Least Squares)
Linear regression, or ordinary least squares (OLS), is the simplest and most classic linear method for regression.
It is a supervised machine learning algorithm used for predictive analysis of continuous/real or numerical variables like salary of a person, age, speed, energy consumption, height of population, sales, product price, temperature, humidity and many more. It is one of the easiest and most popular algorithms.
It shows a linear relationship between a dependent(y) and one or more independent variables(x), hence called linear regression.
Since linear regression shows the linear relationship, which means it finds how the value of the dependent variable is changing according to the value of the independent variable.
In the above figure we can see that there is a linear relationship between dependent(y) and independent(x) variables. And there is one line which is called Best Fit Line, which tries to fit the data according to direction of relation.
Equation of Linear Regression
Our main aim is to find the best fit line that means the error between predicted values(ŷ) and actual values(y) should be minimized. The best fit line has the least error.
The different values for weights or the coefficient of lines (β0 & β1) gives a different line of regression, so we need to calculate the best values for β0 and β1 to find the best fit line, so to calculate this we use cost function.
Cost Function
The different values for weights or coefficients of lines(β0 & β1) gives the different line of regression, and the cost function is used to estimate the values of coefficients for the best fit line.
Cost functions optimize the regression coefficients or weights. It measures how a linear regression model is performing.
We can use the cost function to find the accuracy of the mapping function, which maps the input variable to the output variable. This mapping function is also known as Hypothesis function.
For linear regression we use MSE(Mean Squared Error), which is the average error between predicted values and actual values.
What are the Residuals?
The distance between actual value(y) and predicted value(ŷ) is called Residual. If the observed points are far from the regression line, then the residual will be high, and so cost function will be high. If the scatter points are close to the regression line, then the residual will be small and hence the cost function.

Gradient Descent for Optimization of Cost Function
Gradient Descent is used to minimize the MSE by calculating the gradient of the cost function.
A regression model uses the gradient descent to update the weights or coefficients of the line by reducing the cost function.
It is done by random selection of coefficient values and then iteratively updating the values to reach the minimum cost function.
Model Performance
The Goodness of fit determines how the line of regression fits the set of observations. The process of finding the best model out of various models is called optimization.
Few metric tools we can use to calculate error in the model
1.MSE (Mean Squared Error)
2.RMSE (Root Mean Squared Error)
3.MAE (Mean Absolute Error)
4.MAPE (Mean Absolute Percentage Error)
5.R2 (R — Squared)
6.Adjusted R2
From above all metrics the most important are R2 and Adjusted R2.
R2 (R — Squared)
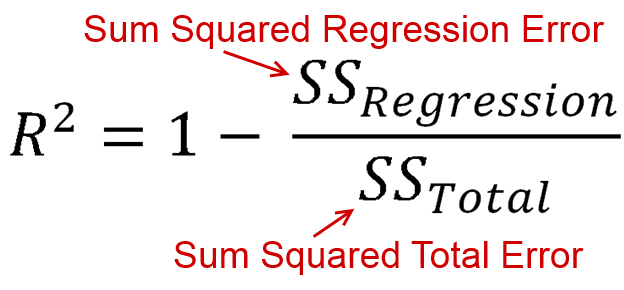
Coefficient of Determination or R² is another metric used for evaluating the performance of a regression model. The metric helps us to compare our current model with a constant baseline and tells us how much our model is better.
The constant baseline is chosen by taking the mean of the data and drawing a line at the mean. R² is a scale-free score that implies it doesn’t matter whether the values
are too large or too small, the R² will always be less than or equal to 1.

R2 = Explained Variation / Total Variation
Adjusted R2
Adjusted R² depicts the same meaning as R² but is an improvement of It. R² suffers from the problem that the scores improve on increasing terms even though the model is not improving which may misguide the researcher. Adjusted R² is always lower than R² as it adjusts for the increasing predictors and only shows improvement if there is a real improvement.

Assumptions of Linear Regression
- There should be a linear relationship between dependent and independent variables.
- No multicollinearity between independent variables.
- Mean of residuals should be zero or close to zero as much as possible. It is done to check whether our line is the best fit line or not.
- There should be homoscedasticity or equal variance in a regression model. This means that the variance around the regression line is the same for all values of the predictor variable(x).
