Optimize Power BI Reports with Field Parameters: Say Goodbye to Bookmark OverloadPower BI is packed with features that make it easy to create interactive, insightful reports. Bookmarks have been a mainstay for providing…Nov 3, 2024Nov 3, 2024
Power BI Workspaces vs. Apps: Which Is Best for Your Organization?Power BI’s dynamic data architecture offers impressive flexibility, particularly when it comes to publishing reports. In this blog, we’ll…Oct 1, 2024Oct 1, 2024
Resolving Power BI Theme Discrepancies Between Desktop and AppsRecently, I encountered an issue with the “Accessible Default” report theme in Power BI. While the theme appeared as expected in Power BI…Sep 2, 2024Sep 2, 2024
Effective Relationship Management in Power BI: USERELATIONSHIP() vs. Role-Playing DimensionsIn traditional data models, multiple dynamic joins can be created based on different values between tables. However, in Power BI, you can…Aug 26, 2024Aug 26, 2024
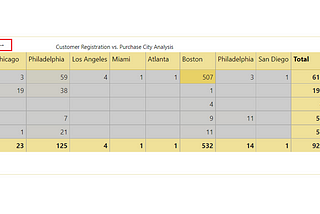
Customizing Row and Column Headers in Power BI MatrixPower BI matrix visuals are a powerful tool for data analysis, enabling users to organize and display complex datasets effectively. While…Aug 11, 2024Aug 11, 2024
Replace Average Ratings With Star symbolsIt would be a best practice to show visuals rather than numbers. In Power BI we can replace the numerical values of ratings with unicode…Feb 27, 2023Feb 27, 2023