Sarad Bade ShresthaTableau Tutorial — How to create a % of Total ChartThe dataset being used below is the Superstore Dataset available on Tableau Community.Jul 3Jul 3
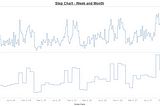
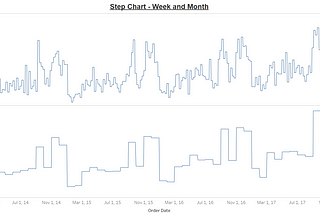
Sarad Bade ShresthaTableau Tutorial — How to create a Step ChartThe dataset being used below is the Superstore Dataset available on Tableau Community.May 21May 21
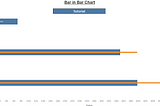
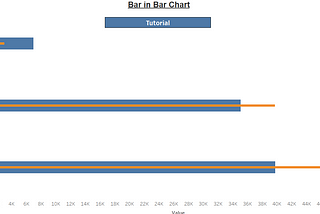
Sarad Bade ShresthaTableau Tutorial — How to create a Bar in Bar ChartThe dataset being used below is the Superstore Dataset available on Tableau Community.May 6May 6
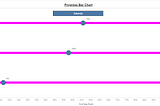
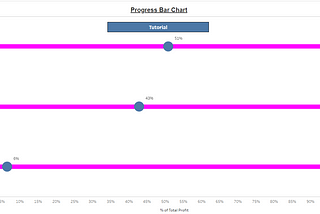
Sarad Bade ShresthaTableau Tutorial — How to create a Progress Bar ChartThe dataset being used below is the Superstore Dataset available on Tableau Community.May 3May 3
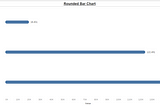
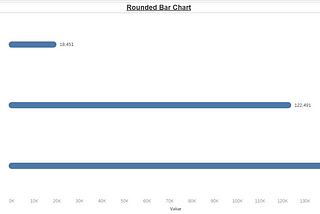
Sarad Bade ShresthaTableau Tutorial — How to create a Rounded Bar ChartThe dataset being used below is the Superstore Dataset available on Tableau Community.Apr 30Apr 30
Sarad Bade ShresthaTableau Tutorial — How to create a Donut ChartDonut Charts are similar to a pie chart but the center can be a great way of making space to include more information about the data (eg…Dec 22, 20221Dec 22, 20221
Sarad Bade ShresthaTableau Tutorial — How to create a Proportional Symbol ChartProportional Symbol Charts are used when there are big variations between values when seeing fine differences between data is not so…Dec 15, 20221Dec 15, 20221
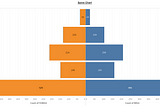
Sarad Bade ShresthaTableau Tutorial — How to create a Spine ChartSpine Charts are visuals that splits a single value into two contrasting components (eg male/female)¹.Dec 9, 2022Dec 9, 2022
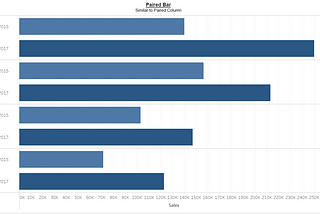
Sarad Bade ShresthaTableau Tutorial — How to create a Paired Bar ChartPaired Bar Chart is similar to standard bar charts but allows for multiple series. However, the visual can get tricky to read with more…Dec 2, 2022Dec 2, 2022
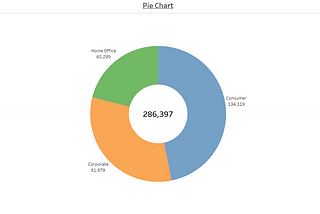
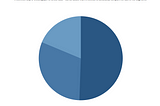
Sarad Bade ShresthaTableau Tutorial — How to create a Pie ChartPie Chart is a common way of showing part-to-whole data — but be aware that it’s difficult to accurately compare the size of the…Nov 23, 2022Nov 23, 2022