Support Vector Machines
Support-vector machines are a type of supervised learning models which are used for classification and regression analysis. SVM can not just perform the linear classification but also the non-linear classification by the help of the Kernel trick. in case of classification using SVM, we take the help of margins too separate the different available classes.
Introduction to margins of separation:
Margin of separation as the name itself suggests is some sort of margin or boundary which is used as a separation between different classes. These classes can be of various types like pizzas and burgers. The bifurcation of classes into class-A and class-B has been done because pizzas and burgers and not the same type of dish, they have uniqueness in the properties(like taste, shape, size, color and mode of preparation).
So in order to classify them into respective classes, we will use the concept of margins. Here the value of ‘y’ will be either 1 or -1 which in layman terms would mean that either a dish would fall under the category of pizzas(denoted by +1) or it would not fall under the category of burgers(denoted by -1). From the diagram below, things will become much clear. We can have ’n’ number of pizzas and burgers with us and mathematically we can represent them as;


Here we can visualise the datapoints and let us assume that green points denote pizzas and blue ones denote burgers. We have something called as ‘maximum-margin hyperplane’ which is the distance between the two parallel hyperplanes(shown by dashed lines) chosen in such a way that the distance between the pizza class and burger class remains maximised.
The equation of a hyperplane can be given as ;

where w is the is the normal vector from the line of separation and x is the datapoint.
(w and x are both vector in nature with both magnitude and direction) and b is bias i.e the distance between hyperplane and the origin.

Here in the diagram;
(w . x )-b = 1( dashed margin above maximum margin hyperplane)
and (w . x) -b = -1( dashed margin below maximum margin hyperplane).
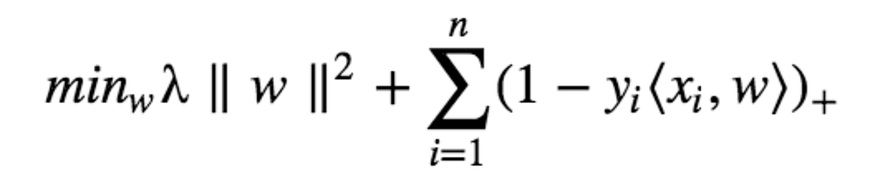
It is better to have a large margin, even though some constraints are violated. In order to find the maximum margin , we need to maximize the margin between the data points and the hyperplane.


In order to maximize the margin, we need to minimize |w|;

here yi = +1

here yi = –1
this can be combined into;

Non — linearly separable data:
The data which we will come across will not be linearly separable and so we need to understand that how must we deal with such non- linearly separable data. A simple trick is that we can change the present dimension in which the data points have been plotted to some other (maybe greater dimension). Before going to that, here is an example of non-linearly separable data from practical use case.

Here we see how addition of a new dimension(z-space) can help us in classifying the non-separable data set. This is achieved by the help of Kernels. . By using kernels we define a new dimension (called as z-space). By introduction of this z-space we have some effect on our constraints as well;
This gets modified a bit where x is replaced by z which is in higher dimension space.
Kernels can be defined as;

While applying kernels having two input features, and then we have our dot product. The most frequently used kernels are;
Linear Kernel
Polynomial Kernel
Sigmoid Kernel
RBF Kernel
Gaussian Kernel


Here the parameter which we see in the highlighted section given as C, is the regularization parameter and it gets multiplied to our slack variable.
Multi class classification using Support Vector Machines:
When we have more than two classes to group into we use MCSVR. We use either of the following methods to achieve the classification;
OVR i.e ONE vs REST and the other technique used is OVO i.e ONE vs ONE.
Let us see how can we implement SVM using Sklearn;

Applications
SVMs can be used to solve various real-world problems:
- Text and Hypertext categorization can be taken care with the help of SVM.
- Image classification can also be performed using SVMs.
- Classification of satellite data using supervised SVM is yet another application of SVM.
- Hand-written characters can be recognized using SVM.
- The SVM algorithm has been widely applied in the biological and other sciences. They have been used to classify proteins with up to 90% of the compounds classified correctly.
