stockton4/23 hwi’m at the point of lost where i no longer even know what questions i have. i realize this isn’t a complete assignment, i just really feel…Apr 24, 2018Apr 24, 2018
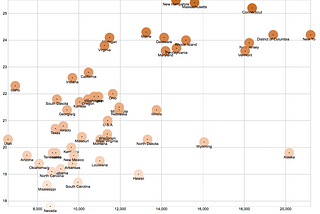
stockton4/16 data viz homeworkI’ve made 3 scatterplots showing my data for Per Pupil Expenditure by State and Average ACT Score by state.Apr 17, 2018Apr 17, 2018
stockton4/9 homeworkInspired by what has now been a 6-day rally at the Oklahoma capitol building, I want to do my final project about education funding…Apr 10, 2018Apr 10, 2018
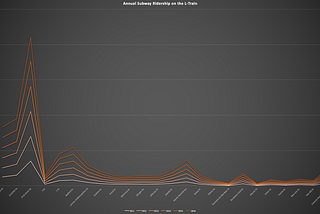
stockton2005 was a wild year for the NYC subway systemThe chart above shows subway ridership for 2003–2017 as shown by month. As you can see, there was a substantial increase in the amount of…Mar 19, 2018Mar 19, 2018
stockton3/5 data viz hwOk so this is a lot less serious than I was hoping my discoveries with this data would be but it’s certainly CURIOUS! This week I stumbled…Mar 6, 2018Mar 6, 2018
stockton2/19/18 homeworkI finalized my decision to work with data about public transportation ridership for my final project. For this assignment, I decided to…Feb 20, 2018Feb 20, 2018
stocktonvisualizing data hw due 2/5In the first article, I really liked that they mentioned to check for the multiple ways the same category could have been recorded — for…Feb 6, 2018Feb 6, 2018
stocktonvisualizing data hw due 1/29This sketch shows data about cities I’ve lived in as well as the color of my hair, the job I held, the pets I had, my favorite genre of…Jan 30, 2018Jan 30, 2018
stocktonnovember 7 readingI think Hillary Clinton’s policies surrounding homeownership are incredible. I am especially fond of her idea about a $10,000 match on down…Dec 19, 2016Dec 19, 2016