Real-world Case Study: Comprehensive Application of Learned Skills(WAREHOUSE SALES AND RETAIL…The warehouse and retail sales dataset is a large data containing over 30000 rollsDec 30, 2023Dec 30, 2023
SHOPPING TREND DISTRIBUTION DASHBOARDThe dataset on shopping trends shows the following columns Customer ID ,Age ,Gender ,Item Purchased ,Category, Purchase Amount (USD)…Dec 26, 2023Dec 26, 2023
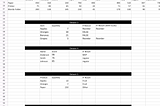
Crafting Informative Dashboards and ReportsCreating effective dashboards involves a balance between clarity and insight. Start by understanding your audience’s needs and focus on…Dec 26, 2023Dec 26, 2023
LEVERAGING MAP AND PIE CHART VISUALIZATION TO CONVEY GEOGRAPHICAL PATTERNS AND PROPORTIONAL DATA…Dec 25, 2023Dec 25, 2023
UTILIZING HISTOGRAMS AND SCATTER PLOTS FOR INSIGHTFUL DATA VISUALIZATIONHistograms are great for displaying the distribution of a single numerical variable. They show the frequency of data within different…Dec 23, 2023Dec 23, 2023
Line graphs are great for displaying trends or changes over time.Line graphs are great for displaying trends or changes over time. They’re useful for illustrating how data points are connected and how…Dec 22, 2023Dec 22, 2023
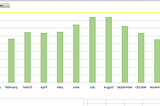
Exploring Column and Bar Charts for Data VisualizationColumn and bar charts are fantastic tools for visualizing data. Column charts display data vertically, while bar charts present data…Dec 21, 2023Dec 21, 2023