Sarah Kay MillerinNightingaleCatching Up With Giovanni Magni of Accurat Design StudioAccurat’s head of data visualization spoke to Nightingale about asking questions in data viz, collaborating with data scientists, and moreMay 13, 20201May 13, 20201
Sarah Kay MillerinDomo UXData viz resources for hungry designersHelpful resources for designers interested in data vizJun 5, 20191Jun 5, 20191
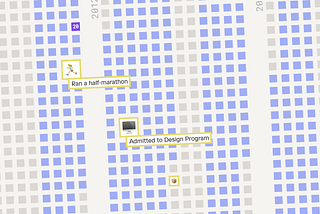
Sarah Kay MillerinNightingale10,000 Days of LifeA data visualization documenting a lifetime.May 28, 20192May 28, 20192
Sarah Kay MillerinDomo UXDesigning a *functional* futuristic user interfaceAre you a fan of the floating blue graphics that Tony Stark casually flips through in Ironman? Do you drool over those futuristic screens…Mar 4, 20191Mar 4, 20191
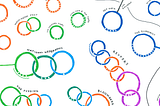
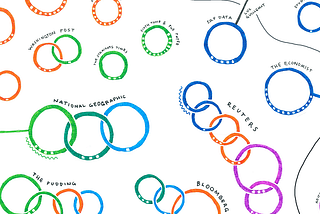
Sarah Kay MillerData rings: a community of data viz creatorsThe Kantar Information is Beautiful Awards is an annual awards ceremony that celebrates the work made by the data visualization community…Jan 15, 20191Jan 15, 20191
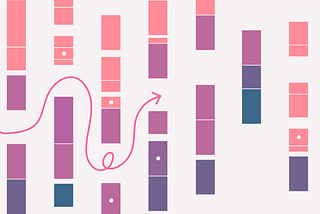
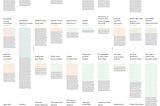
Sarah Kay MillerThe long and winding path to university graduation — visualizedIt took me seven years to complete my undergraduate degree. Students each have a unique path and journey through higher education. This is…May 8, 2018May 8, 2018
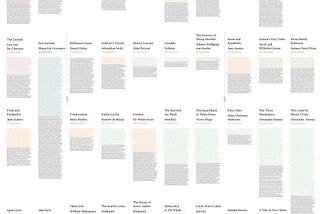
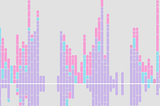
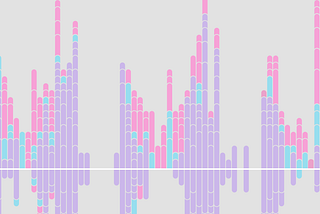
Sarah Kay MillerHow often do characters chat?Who talks more: Huck Finn or Robinson Crusoe? Turns out, it’s Huck. Conversation between the characters in The Adventures of Huckleberry…May 7, 2016May 7, 2016
Sarah Kay MillerHugs Method postEvery wonder how much you hug? Or how often your friends hug? A little curiosity can go a long way…Mar 16, 2016Mar 16, 2016