Power BI Reports on TVs and other screens using Power BI Slider

Introduction
Data is fundamental for decision-making, and the ability to visualize and present this information efficiently is essential. Microsoft Power BI stands out as a powerful tool for data analysis and the creation of interactive dashboards. However, the continuous and automatic presentation of these dashboards on monitors or TVs has always been a challenge.
The Problem
In December 2023, Microsoft decided to discontinue its Windows application designed for this purpose, leaving users “orphaned” of this functionality. The only option natively offered by the company is the integration with PowerPoint, which, to be honest, is not very practical.
We tested several tools available on the market for this purpose, but none of them seemed very practical or easy to configure. Most of them require accessing the Azure account, creating an application for the tenant, sharing this ID, and only then starting to use the feature. Additionally, the cost-benefit did not seem interesting, nor did the limitations on screens and reports.
The Solution
This is where Power BI Slider comes in, a simple solution that promises to transform how we display our Power BI dashboards. Without the need for complicated installations, the tool simplifies the process, requiring only a valid Microsoft Power BI account, a browser, and internet access. It is ideal for corporate environments, meeting rooms, events, or any situation where continuous data visualization is necessary.
Key Features
- Automation: You can automate the presentation of your reports by defining specific pages to be displayed, the viewing time for each page, and intervals for checking data updates.
- Easy Integration: Integration with your Microsoft Power BI account is straightforward. Just log in, and all reports and permissions are loaded automatically, without the need for extensive manual configuration. The platform uses the OAuth2 authentication flow provided by Microsoft, ensuring a fully secure and reliable process.
- Read-Only Control: The platform does not have access to modify or update reports or workspaces, access data in datasets, or any other data of your tenant. This ensures that your security and data integrity are maintained.
- No Limitations: All Power BI Slider plans have no limitations on the number of reports, screens, or usage time, providing unparalleled flexibility for its users compared to competing platforms.
- Free Trial and Cost-Benefit: As of the time of writing this article, a 15-day free trial is available, allowing users to explore all features before committing financially. No credit card is required to test the platform. After the evaluation period, plans start at $20 per month.
Using Power BI Slider
There are two ways to access the tool:
- Using browser extensions, available for Google Chrome, Microsoft Edge, and Mozilla Firefox.
- Directly through the website https://powerbislider.com.
Browser Extensions
- To install the extension on your browser, go to the extension store of your browser. For example, in Google Chrome, you can do this by going to Settings -> Extensions -> Visit Chrome Web Store.

- Next, search for the Power BI Slider extension.

- After installing the extension, it will be available in your browser’s extension menu. I particularly like to pin it to the toolbar for quick access.

- When you click on the extension icon, you will see a message indicating that you should access the site app.powerbi.com. This is because Power BI Slider needs to know which report from your Power BI repository you want to automate the presentation for. The way to inform this is by opening the report in the browser through the Power BI portal. It’s that simple.

- After accessing the Power BI portal and opening the desired report, simply click the extension icon again. Note that the icon will be yellow, indicating that the report is ready for presentation. Press the “Presentation Mode” button to configure the presentation parameters.

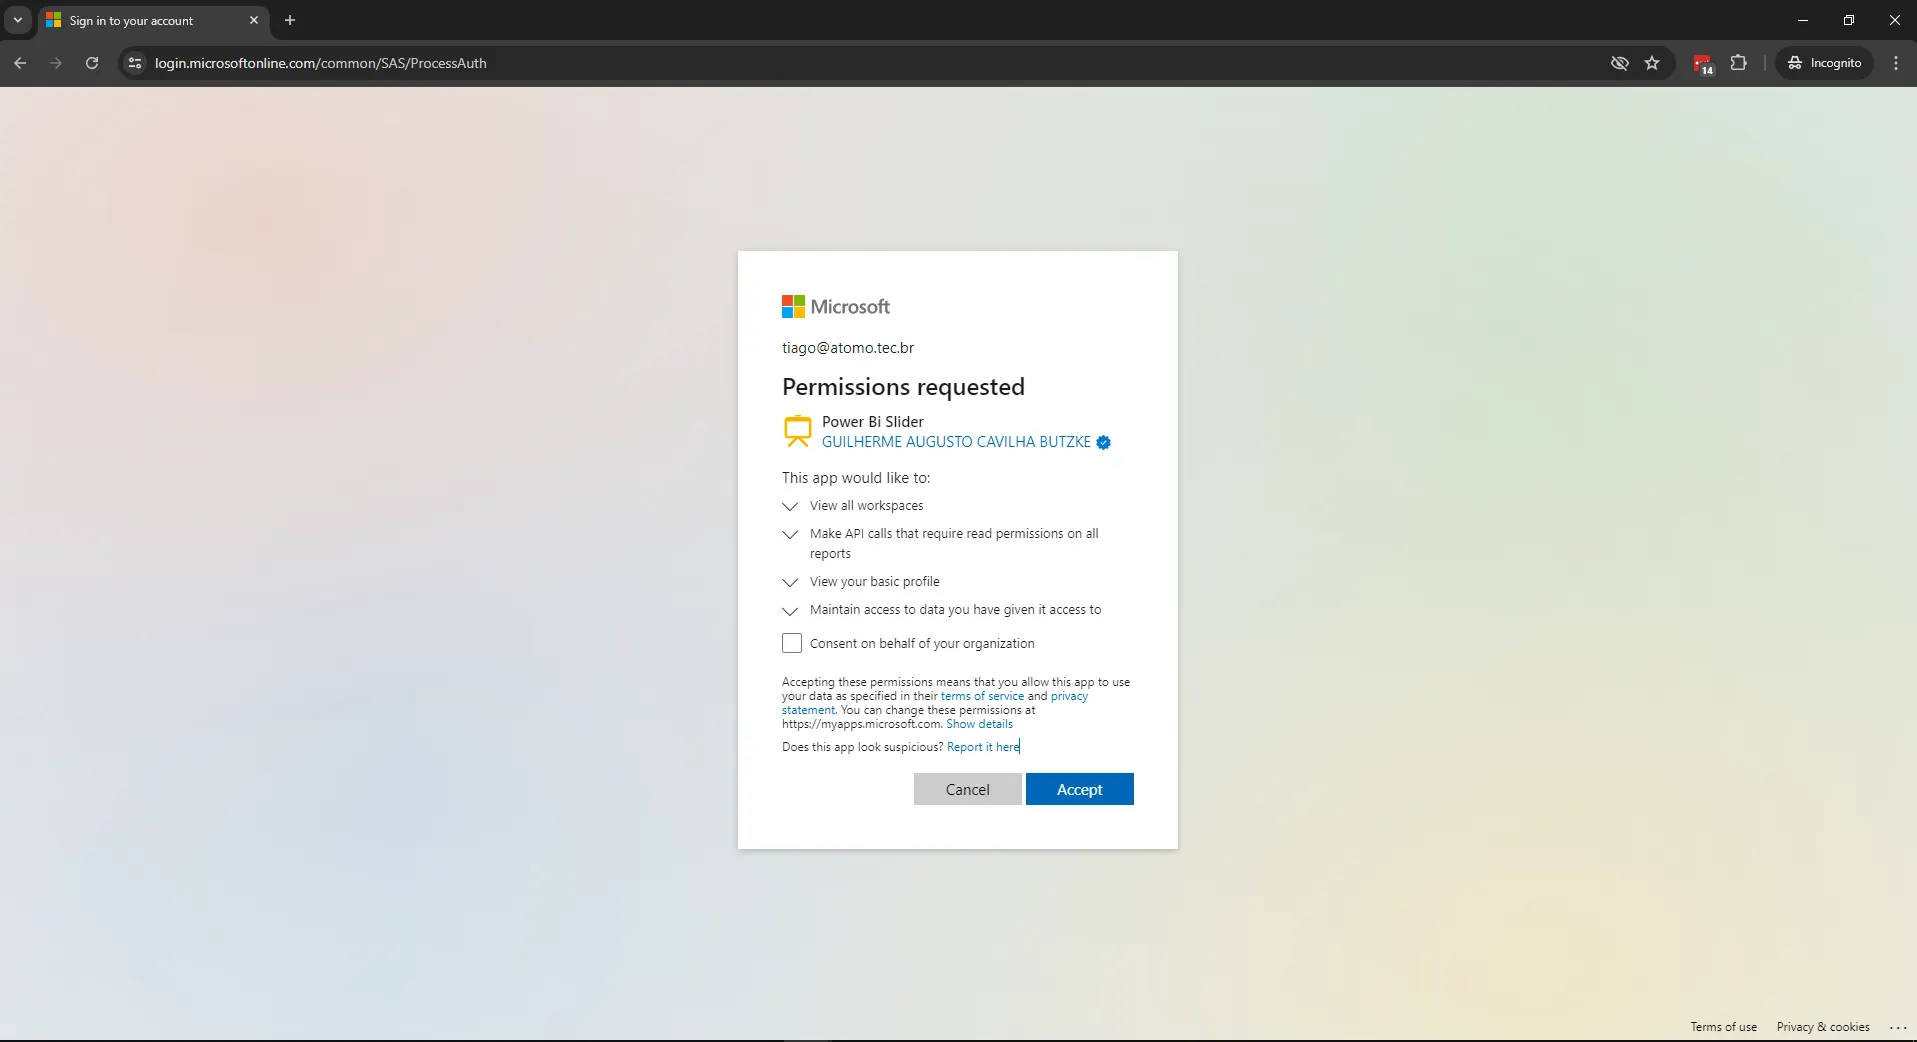
- If this is your first time accessing it, the platform will request permission to view your workspaces and reports. This is necessary for the automation to be carried out.
- Configure the time parameters for checking data refreshes (in minutes), which pages you want to include in the presentation, and how many seconds each page should remain on the screen. Finally, just save the settings and start the presentation. The data will be saved locally in the browser for future access.

Accessing via Platform Website
- Go to https://powerbislider.com. Click on Sign in with Microsoft to log in.

- If this is your first time accessing it, the platform will request permission to view your workspaces and reports. This is necessary for the automation to be carried out.
- Upon entering the platform, the workspaces to which you have access will be listed. Open the one where the report you want to present is located.

- When you select a workspace, the reports belonging to it will be listed.

- After opening the desired report, press the “Settings” button located at the top right of the report and configure the time parameters for checking data refreshes (in minutes), which pages you want to include in the presentation, and how many seconds each page should remain on the screen. Finally, just save the settings and start the presentation. The data will be saved locally in the browser for future access.

Can I Use It Directly on the TV Browser?
In the tests we conducted, the tool worked very well on newer TVs, especially those from Samsung. This is mainly because these TVs already have a dedicated processor, which offers much better performance. TCL TVs with Android TV also performed very well in the tests. Amazon’s Firestick also showed good performance, although not as good as the previously mentioned devices.
In the tests conducted on LG TVs, we were unable to get the tool to work on the default embedded browser.
The ideal usage scenario is with a computer connected to the TV, regardless of the minimum resources it possesses. The important thing is to have a processor that can smoothly open the Power BI online environment.
Conclusion
Power BI Slider is undoubtedly a valuable addition to any organization using Microsoft Power BI.
Its ability to simplify the process of presenting dashboard data, emphasizing quick setup and data security, makes it an ally in the dissemination of information within organizations. I suggest you try the 15-day free trial and draw your own conclusions.
