A Techy’s Introduction to Neuroscience
Some Facts I Wish I Knew When I Started Hacking EEG
I know I’ve said this before, but it’s worth saying again: we live in amazing times. We can now conduct neuroscience experiments in the comfort of our own homes, using equipment that was until recently very expensive and available only in research labs/universities. Now that the equipment has become more readily affordable, more people are exploring what they can do with the technology, and lucky for us, there is a worldwide community of researchers that is accessible online.
Over the course of the past few months, I’ve found myself entering the amazing world of neuroscience and have learned a lot — though in this process I sometimes got confused by all the technical and domain-specific terms when I tried to read articles or check out examples.
In this post, I will try to summarize all my learnings from the past year. While I’ll present these things from my perspective as a web developer, I am pretty sure this introduction will be helpful to anyone who is interested in getting into the subject.
I want to extend special thanks to Alexandre Barachant and Hubert Banville from the NeuroTechX community. They spent numerous hours helping me to find my way as a beginner in the neuroscience world, and much of the information presented here was first presented to me by them.
BCI? EEG?
Coming to neuroscience from a computer background, two of the first terms I encountered were “BCI” and “EEG.” BCI stands for Brain Computer Interface (or BMI for Brain Machine Interface). A BCI is essentially any method that directly transfers information between a brain and some external device, usually a scientific instrument or, for our purposes, a computer.
A BCI method is made up of three parts:
- A brain sensing device (EEG, fNIRS, ECoG, fMRI, etc.)
- A decoding algorithm, which translates the brain activity measured withthe sensor to a command
- And a machine (or a computer) that executes the command
EEG is perhaps the most common brain sensing modality within BCI. EEG stands for Electroencephalography. To be honest, I never remember this word — what is important to remember, is the EEG records the electrical activity around you scalp, using electrodes, in order to measure brain activity. This is a very coarse, inaccurate way to measure the brain activity — as the electromagnetic waves are attenuated by the skull. However, there are still very interesting things we can do with EEG, and the fact that it’s non-invasive — unlike MRI, doesn’t require a specific environment in which to take readings — means it’s an excellent candidate for tinkering with at home.
There are several other bio-sensing techniques that use a similar method to measure your body — ECG for measuring heart activity (see below), EMG for measuring muscle activity and EOG for measuring eye movements (we’ll talk about that later). All the above work by measuring electrical voltage difference between two or more points in your body.
In addition to EEG, there are a number of other BCIs, such as fMRI, but since you’re not able to do fMRI and many of the other BCIs at home (yet!), we will focus on EEG.
First of All: Some Things to Know About EEG
When I first learned about EEG, I discovered that I had a few ideas about EEG that didn’t match up with reality… so, before we dive into the specifics, I’d like to take a minute get a few things straight.
You can’t really “read the brain” in the EEG graph. When I initially started with EEG, I expected I could learn how to “read minds” through the EEG graphs and develop some kind of ability to tell what each spike means in its context. Later, I discovered that the things you can see in the graph are primarily noise and things which are not “EEG” per-se, such as eye blinks, jaw clenches.
With EEG, you will only be able to see very strong brain activity, such as an epileptic seizure (which I really hope you never need to see). The general rule of thumb is, “If you can see it with your eyes unaided, it’s probably not EEG.”

For anything more than that, you would need to process that data, and in some cases, run several iterations of the experiment until you can actually get the signal you’re looking for. So remember: a good EEG graph is a clean one.
You can’t read thoughts. You can’t get very specific information using EEG, such as what the patient is seeing or hearing. The only information you get in the sum of the activity of many neurons in your brain — you’ll only ever be able to identify something if it’s really drastic and involves a lot of neurons firing in sync.
A common analogy is standing outside a big sports stadium — you will not be able to hear specific conversations between the people inside the stadium, but you will be able to discern an empty stadium v.s. a very full stadium, and you’ll also be able to detect when a goal is scored — as you will hear sudden loud applause and cheering coming from the audience in sync.
EEG doesn’t work for everyone. Some people have what they call “BCI illiteracy,” i.e.. we can’t pick up any signal for specific brain patterns on some subjects. This is, in fact, pretty common — about 20% of the population have some sort of BCI illiteracy, and there is research going on how to work around that.
EEG is READ-ONLY. I often get asked if an EEG headset can be used to inject thoughts or modify people’s behavior by affecting their brains. The short answer is no: you can’t control people’s minds with EEG.

What you can do though, is provide Neurofeedback, which can be used to try and modify behavior (using the feedback loop: brain → EEG → physical action/message → brain). Neurofeedback is often used to try and teach a patient how to achieve better control of their brains, and is sometimes used to treat conditions like ADHD and migraines, though the role of EEG in such treatments is questionable.
Hello, World
In programming, “Hello World” is the very first program beginners write in a language — a program that prints “Hello World”. In electronics, this is usually done by blinking an LED.
With EEG, my Hello World was detecting eye blinks. I then built a small demo where you could play the Chrome Offline T-Rex game with just your eyes. Creating both of these demos requiring gaining a more in-depth understanding of what EEG was and how it worked, and I’ve tried to summarize what I’ve learned in the sections below.
As ever, if you have any questions or thoughts, let me know in the comments below :-)
Voltage / Potential Difference
One thing that’s important to note before we get started is that “voltage” and “potential difference” are often used interchangeably when discussing EEG and neuroscience. This is because voltage is defined as the potential difference between two points: since voltage is measured relatively, you always need to specify two points when you speak about voltage.
The 10–20 System
One of the things that I found to be kind of intimidating at first was all these allusions to things like “FP7” and “TP10.” Then I learned that these are just positions, a part of the 10–20 system that scientists use to notate where on the scalp they’re putting the electrodes when doing tests/research with EEG.
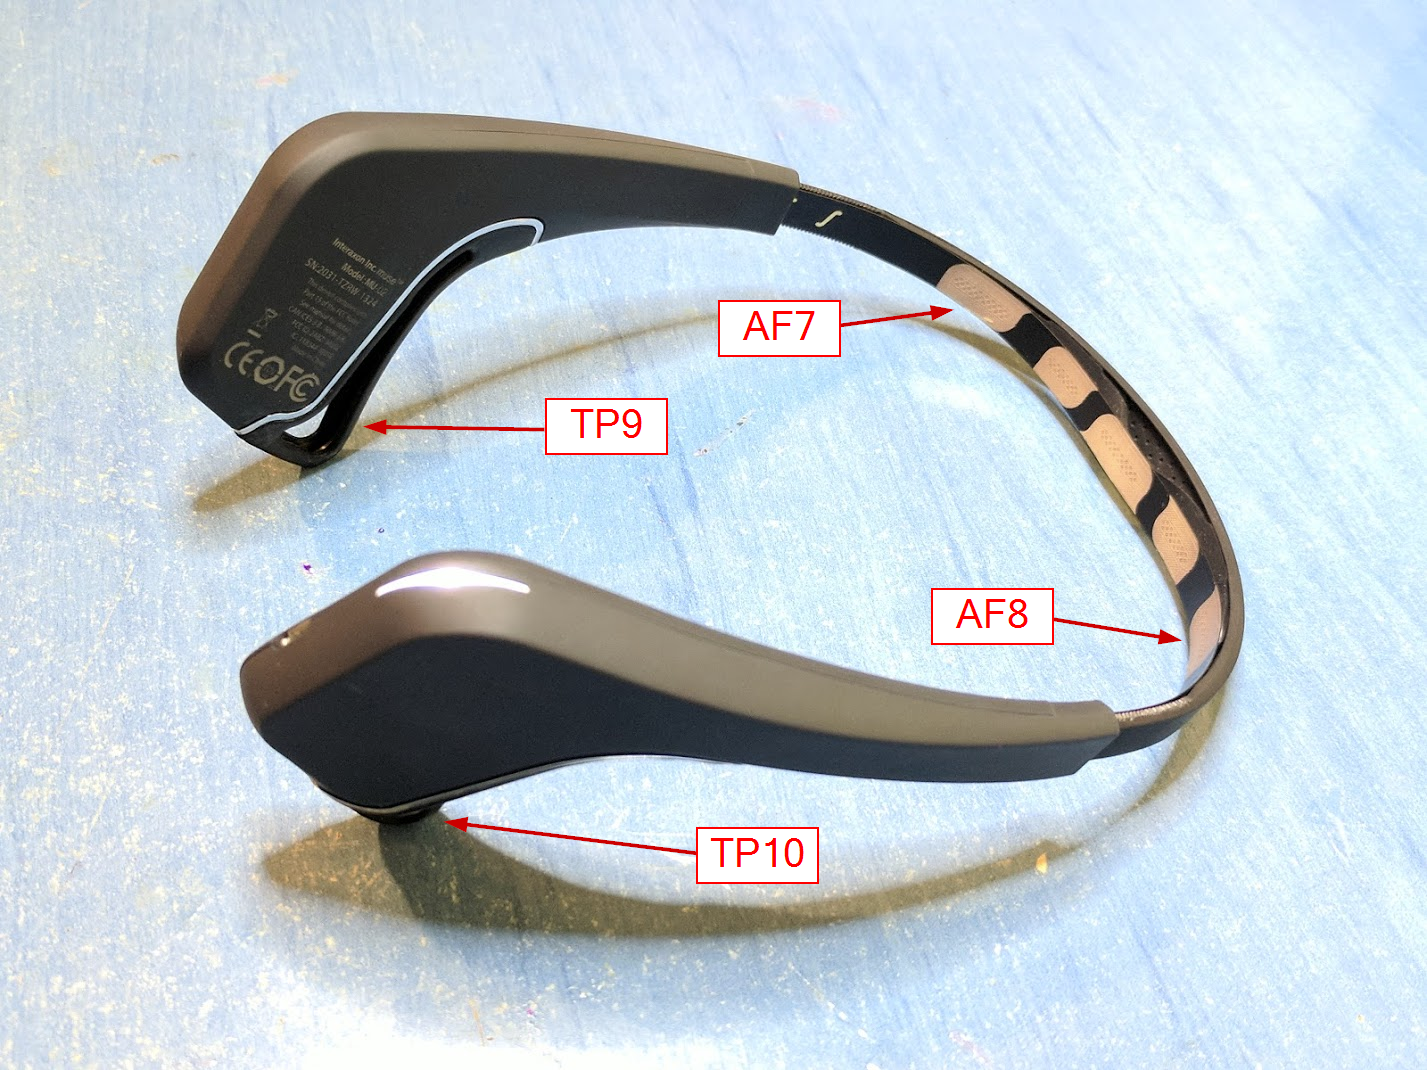
When you’re using commercially available products to do your own EEG experiments, most of the time they’ll have already determined which electrodes you have to work with, so you shouldn’t have to worry too much about the 10–20 system yourself. For example, the 2016 version of the Muse device targets the AF7, AF8 TP9 and TP10 electrodes.

The diagram shown above is a top-view of the head the “nasion” is the nose, then the sides (A1/A2) are the ears, and INION is the back of the head, or more technically, “the projecting part of the occipital bone at the base of the skull.”
Reading The EEG Graph
If you have ever seen an EEG graph, it can be confusing at first glance — there is a lot going on. Let’s try to make sense of it together — each element in the graph represents the signal picked by a different electrode. The horizontal axis (X-Axis) is the time, and the vertical (Y-axis) is the voltage recorded at that point in time between the relevant electrode and the reference electrode (remember? voltage is the electrical potential difference between two points).
Below you can see an annotated EEG graph, recorded by Alexandre Barachant using a new EEG headset device he is currently developing. The graph was recorded over a time span of 10 seconds, using 8 electrodes located at FP1, FP2, P3, Pz, P4, POz, O1, O2 (see above regarding the 10–20 system).
I added several markers to the graph, showing features such as Alpha Waves (green marker), 4 eye blinks (purple marker) and one Jaw Clench (cyan marker). We are going to discuss these things shortly.

Brain Waves: Alpha, Beta, Delta, Theta
Brain waves are neural oscillations , or more simply, neural activity that happens with a specific rhythm. Like other kinds of wave, we measure this rhythm in terms of frequency using the Hertz measurement unit. So for example, if you have neural activity with the voltage going up then down 7 times a second, that would be a 7Hz brain wave.
Common brain rhythms receive shorthand names to reference in research, such as Alpha, Beta and Theta brain waves. Beta waves, for examples, are those in the 12.5Hz–30Hz range. You see these normally while the subject is awake. Gamma waves, on the other hand, are used to refer to a faster rhythm, usually above 40Hz, and some researchers believe they are associated with focus, attention and meditation. I believe this is the scientific idea behind the Muse EEG Headset, which is supposed to be used to help meditation (among other things).
Delta waves, surprisingly, have a much slower frequency (between 0.5 and 2Hz) and they are also a lot stronger: the signal goes much higher than the other wave kinds. They are associated with the deep sleep stages, so it’s a simple way to measure whether a subject is experiencing deep sleep. Research shows that interfering with sleep during the delta waves stage caused fatigue and muscular pain.
Finally, another kind of waves, called Alpha waves, seem to appear in parts of the brain which are currently idle. Their frequency is around 7.5Hz — 12.5Hz, and the easiest way to observe them is to place an EEG electrode at the back of your head, next to your Visual Cortex, and then close your eyes. The idle neurons in the Visual cortex will start firing these alpha waves synchronously, and you should be able to recognize the pattern in the graph. This is also a good way to quickly test your EEG setup: if you don’t see the Alpha waves when you close your eyes, then something is definitely wrong (well, I mean — you should see them after you have opened them again, of course…).
Here is a screen shot from my angular-muse app, showing Alpha waves. The point marked by the red marker is when I opened my eyes, and you can see both the potential difference caused by the eyeball movement (EOG — see below), and after that the change in the pattern. It was measured in TP9 — near my ears, not an optimal place to look for Visual Cortex Alpha waves, but they are strong enough so they can still be seen there:

ERP — Event Related Potential
An Event Related Potential (ERP) is simply a spike that you can measure with EEG equipment that happens in response to a stimulus. For example, whenever you see a face, a negative voltage spike that appears approximately 170 milliseconds in the EEG graph (it even works for parts of the face, such as eyes).
Let’s go over a few examples to make it more clear:
P300
P300 is a positive spike that appears around 300 milliseconds after a stimulus that evokes your interest. For example, if you are waiting for a friend to pick you up, and there are many cars passing by, you will probably have a positive voltage spike whenever you see a car that resembles your friend’s car. P300 is best picked up at the back of your head — around POz or Pz (see 10–20 system above).
For example, let’s look at a brain invaders game developed by Alexandre Barachant during his first post-doc, which shows P300 in action. This is the standard invaders game with a twist — on each level you have to destroy one specific invader, which is marked by a red circle at the beginning of the level. You should do it by focusing on that invader, and counting the number of times it gets highlighted. The game itself highlights different subset of the invaders, for several iterations, and each time after highlighting a subset, it looks for a positive signal 300 milliseconds after the highlight (that’s the P300!).
Then, it looks for an invader that has appeared in all the different subsets with had the P300 signal, and that invader is destroyed. Assuming that you kept focusing on the target invader, only the subsets that highlight it would exhibit P300, and then it would be destroyed and you win the level. This is what it looks like in action:
You can read more about the game here, or take a look at the source code.
Another interesting use case is a P-300 based speller, where the user can spell words by focusing on the letters they want to type one at a time, where the letters then become highlighted in a similar fashion to the invaders game:
The guy in the video is using an EEG headset called Emotiv. Here is another P300 demo, where you can also see how the system was trained. It is built around the Cognionics Dry EEG system.
While a speed of one word per minute (or less) may not seem impressive, there are people out there for whom this might be their sole way to communicate (e.g. Locked-in syndrome, where preliminary research shows promising results for using this technology in diagnosis). Using ‘smart next word’ prediction can also help to speed it up, allowing much more efficient communication. Perhaps this is why Facebook is also looking in this direction.
N170, N100 and other interesting ERPs
N170 is a negative spike that appears approximately 170 milliseconds after seeing a face or part of face, such as eyes.
N100 is antoher kind of ERP, and as you can guess by the name, is appears approximately 100 milliseconds after an unexpected stimuli when you are idle, such as a loud noise, sudden pain, etc. One example of a clinical use is for auditory system tests, in cases where patients can’t give feedback, such as when they’re in a coma.
SSVEP
SSVEP stands for Steady State Visually Evoked Potentials. Despite the complicated name, it basically means that if I show you a light source strobing at a specific frequency (3.5 to 75 times per second, according to Wikipedia) for some time, your brain will pick up this frequency, and you will be able to see it in the brain waves.
The length of stimuli you need for the frequency to show up in the EEG graph depends of the frequency, but 1 second should be enough for any frequency greater than 10Hz.

Similar to SSVEP, there is also SSAEP for Audio, and SSSEP for sensory stimulus.
ECG, EMG, EOG via EEG
These three terms refer to measuring heart activity, muscle operation and eye movements by recording electrical activity, similar to what we do with EEG. In fact, an EEG device can easily pick all of the above!
For instance, with the Muse device, if I touch the front electrodes with my right hand, and the ear electrodes with my left hand, I will see a very clear ECG graph, showing my heart’s electrical activity:

ECG signals are way stronger than EEG — they can get as high as 1000 microvolts, while measured EEG activity is maxes at around 100 microvolts.
EMG refers to measuring the electrical signals that come from the activation of our muscle cells. They can also be picked up by EEG equipment — that’s how the Muse device is able to detect, for instance, jaw clenching. Here is what EMG may look like in a graph:


Finally, EOG can record our eyeball movements — this is how the we can easily detect blinks with EEG headsets (you can learn more in my Reactive Brain Waves post).
Devices
There are several consumer devices that let you get started with EEG, such as OpenBCI, which is an open-source EEG hardware + software package. My favorite (and only) device at the moment is Muse, a 249$ EEG device with four electrodes (and the ability to attach an external one). Emotiv is another vendor that produces a device with either 5 or 14 channels, so while they are a somewhat more expensive option (you can’t access the raw signal unless you pay for their very expensive SDK), they can be more useful for research.
How can EEG improve our lives?
EEG can make a real difference for people with restricted mobility, providing a new interface for them to communicate and interact with the outside world (such as the examples using the P300 ERP above).
I was contacted by some researchers from the Ben-Gurion University in Israel who are trying to build a browser extension that will enable browsing the web with an EEG headset. This would be a great benefit to people who are unable to use a keyboard. They are experimenting with both using Eye Movements and P300 (mentioned above) for this purpose. Another interesting project that approached me just last week to assist with the programming is exploring ways to use EEG to help people with ALS. It should be noted though that the ‘bandwidth’ of EEG is currently quite slow, so direct control via EEG (for example, using a mouse or keyboard) might not be realistic at the moment.
Finally, a good friend of mine recently had baby diagnosed with Hypsarrhythmia, a condition having to do with chaotic and irregular electrical activity in the brain. In this case, his baby was lucky to be diagnosed early, but in other, less-obvious cases, this condition might go unnoticed and may negatively affect brain development if not treated in time. He hopes that affordable devices such as Muse will make diagnosing this condition much more affordable, and he is currently looking into how that might be possible.
As EEG becomes cheaper, it’ll be interesting to see what other consumer applications for the technology will pop up (or that hackers like you and I will develop!). One other interesting thing about projects like the Muse sensing spectacles is that we can now relatively easily probe the “mental state” of the person wearing it, giving us an idea of our ability to focus and mental workload (interestingly enough, in the paper linked above, they observed that state there that “experienced meditation practitioners have a very noticeable (EEG) profile”).
It may even help us get better at lucid dreaming… but we’ll have to wait and see about that!
Suggestions for Further Reading
I suggest reading this amazing piece about NeuraLink. It’s no coincidence it was published about a month before I started getting into neuroscience — after reading it, I got inspired to start exploring this field.
Also, if you have a Muse device, definitely check out EEG 101, an open-source Android application that teaches the basics of EEG.
Most importantly, join the NeuroTechX Slack Community! As mentioned above, this was how I learned most of what I know about EEG today, and was the basis for a lot of what you’ve just read above.
